HOT TOPICS LIST
- MACD
- Fibonacci
- RSI
- Gann
- ADXR
- Stochastics
- Volume
- Triangles
- Futures
- Cycles
- Volatility
- ZIGZAG
- MESA
- Retracement
- Aroon
INDICATORS LIST
LIST OF TOPICS
PRINT THIS ARTICLE
by Matt Blackman
The market is showing strong negative divergence again. Is it a pause or the end of another bear rally?
Position: N/A
Matt Blackman
Matt Blackman is a full-time technical and financial writer and trader. He produces corporate and financial newsletters, and assists clients in getting published in the mainstream media. He is the host of TradeSystemGuru.com. Matt has earned the Chartered Market Technician (CMT) designation. Find out what stocks and futures Matt is watching on Twitter at www.twitter.com/RatioTrade
PRINT THIS ARTICLE
RETRACEMENT
Topping Out or Just Taking a Break?
07/18/03 10:47:31 AMby Matt Blackman
The market is showing strong negative divergence again. Is it a pause or the end of another bear rally?
Position: N/A
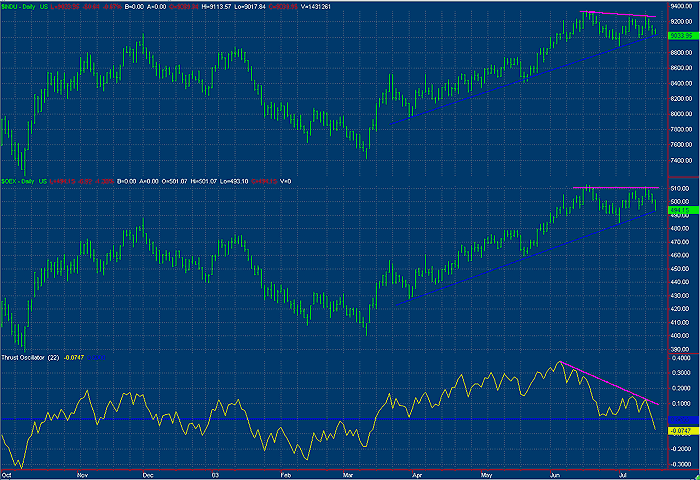
| An interesting article entitled Find Those Market Tops by David Hawkins (Technical Analysis of Stocks & Commodities, July 2003) presented a derivation of the ARMS Index called the Thrust Oscillator. The author claimed it did a pretty good job at picking market tops (hence the title). The formula for TradeStation is available below but basically it used advancing and declining issues together with up volume and down volume on the New York Stock Exchange to provide insight into underlying market strength. Since the article was written, the thrust oscillator has experienced strong negative divergence with the S&P 100 and Dow Jones (as well as the Nasdaq 100). Certainly this appears to be a strong signal of a market top if you believe the thrust oscillator. |

|
| Figure 1 – Daily chart of the thrust indicator (lowest window) plotted with the Dow Jones Industrial Average ($INDU) and the S&P100 Index ($OEX) showing double tops and strong negative divergence (see magenta lines). A top in the making? Confirmation of a break in trend would come if the blue lines were significantly broken. |
| Graphic provided by: TradeStation. |
| |
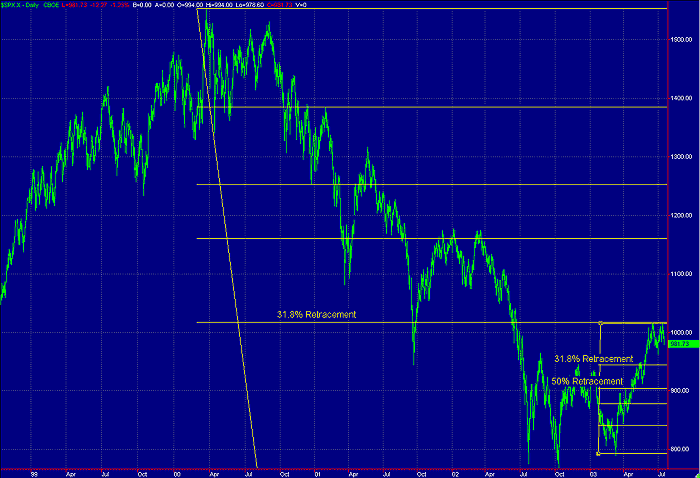
A correction appears imminent but the next question in the minds of traders and investors is by how much? For the answer, let's look at another tried and true indicator. Fibonacci numbers have an uncanny ability to anticipate retracements and it is an interesting exercise to look at how reliable they have been in the past (see Figure 2).  Figure 2 - Daily chart of showing the top of the S&P500 ($SPX.X) of 1553 in March 2000 to the low in October 2002 of 768, the index has retraced almost exactly to the first Fibonacci level of 31.8%. A 31.8% retracement from the October low to July high would take the S&P500 down to 943 and a 50% retracement to 903. |
| It will be interesting to watch and see what the market holds. A maximum 31.8% retracement from the most recent high and subsequent reversal from 943 (or higher) would dispel the opinion that the latest run-up has been just another bear rally. A retracement of 50% to 903 or lower, however, would be just what the bears are looking for and cause them to come out of hibernation with a vengeance. |
| SUGGESTED READING: Hawkins, David [2003] "Find Those Market Tops" Technical Analysis of Stocks & Commodities: July, 2003 TradeStation Thrust Oscillator Download https://www.tradestationworld.com/discussions/topic.asp?TOPIC_ID=13538 |
Matt Blackman is a full-time technical and financial writer and trader. He produces corporate and financial newsletters, and assists clients in getting published in the mainstream media. He is the host of TradeSystemGuru.com. Matt has earned the Chartered Market Technician (CMT) designation. Find out what stocks and futures Matt is watching on Twitter at www.twitter.com/RatioTrade
| Company: | TradeSystemGuru.com |
| Address: | Box 2589 |
| Garibaldi Highlands, BC Canada | |
| Phone # for sales: | 604-898-9069 |
| Fax: | 604-898-9069 |
| Website: | www.tradesystemguru.com |
| E-mail address: | indextradermb@gmail.com |
Traders' Resource Links | |
| TradeSystemGuru.com has not added any product or service information to TRADERS' RESOURCE. | |
Click here for more information about our publications!
Comments
Date: 07/18/03Rank: 4Comment:
Date: 07/23/03Rank: 5Comment:
Date: 07/24/03Rank: 5Comment:

Request Information From Our Sponsors
- StockCharts.com, Inc.
- Candle Patterns
- Candlestick Charting Explained
- Intermarket Technical Analysis
- John Murphy on Chart Analysis
- John Murphy's Chart Pattern Recognition
- John Murphy's Market Message
- MurphyExplainsMarketAnalysis-Intermarket Analysis
- MurphyExplainsMarketAnalysis-Visual Analysis
- StockCharts.com
- Technical Analysis of the Financial Markets
- The Visual Investor
- VectorVest, Inc.
- Executive Premier Workshop
- One-Day Options Course
- OptionsPro
- Retirement Income Workshop
- Sure-Fire Trading Systems (VectorVest, Inc.)
- Trading as a Business Workshop
- VectorVest 7 EOD
- VectorVest 7 RealTime/IntraDay
- VectorVest AutoTester
- VectorVest Educational Services
- VectorVest OnLine
- VectorVest Options Analyzer
- VectorVest ProGraphics v6.0
- VectorVest ProTrader 7
- VectorVest RealTime Derby Tool
- VectorVest Simulator
- VectorVest Variator
- VectorVest Watchdog
