HOT TOPICS LIST
- MACD
- Fibonacci
- RSI
- Gann
- ADXR
- Stochastics
- Volume
- Triangles
- Futures
- Cycles
- Volatility
- ZIGZAG
- MESA
- Retracement
- Aroon
INDICATORS LIST
LIST OF TOPICS
PRINT THIS ARTICLE
by Kevin Hopson
Devon Energy has been in a corrective mode the last few weeks but investors could have gotten out at higher levels if they had noticed the warning signals.
Position: Hold
Kevin Hopson
Kevin has been a technical analyst for roughly 10 years now. Previously, Kevin owned his own business and acted as a registered investment advisor, specializing in energy. He was also a freelance oil analyst for Orient Trading Co., a commodity futures trading firm in Japan. Kevin is currently a freelance writer.
PRINT THIS ARTICLE
TECHNICAL ANALYSIS
How Low Will Devon Energy Go?
07/17/03 10:51:02 AMby Kevin Hopson
Devon Energy has been in a corrective mode the last few weeks but investors could have gotten out at higher levels if they had noticed the warning signals.
Position: Hold
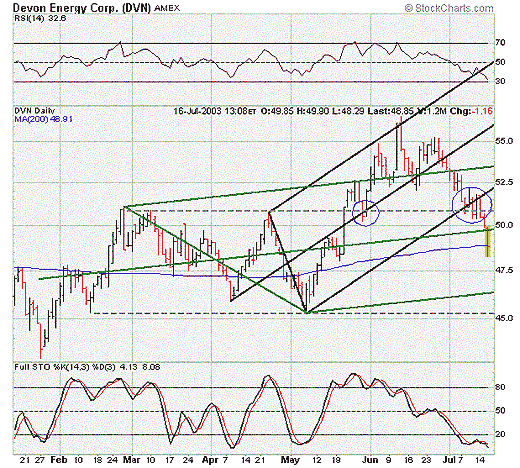
| Devon Energy (DVN), an exploration and production company primarily focused on natural gas, has seen a significant correction over the last few weeks. More specifically, the stock hit a new 52-week high ($56.65) in mid-June, only to see its price fall back below the $50.00 level recently. However, there were some key signs that would have alerted investors to what was coming. |
| For example, if you look at the six-month chart, you will notice that Devon was putting in a pattern of higher highs between the end of May and middle of June. Unfortunately, the relative strength index (RSI), stochastics and moving average convergence/divergence (MACD; not shown on chart ) were all showing negative divergences. In other words, the stochastics and MACD were putting in lower highs, while the RSI continued to find resistance around the 70 level. This indicated a potential topping pattern in the stock. Just to note, most natural gas-related companies were showing similar patterns in mid-June, signaling a potential end to the bull run at that time. |

|
| Graphic provided by: Stockcharts.com. |
| |
| Another sign of things to come was the stock's channel breakout in late May. More specifically, Devon had been trading in the $46.00 to $51.00 range for nearly three months. When the stock moved above the $51.00 level, the channel breakout indicated an ultimate upside target of between $56.00 and $62.00. Since Devon met its initial price target ($56.00) and quickly reversed, it was an indication that a top had likely been put in. |
| Even if investors had failed to get out at the top, a recent sell signal could have reduced further losses. For example, notice how Devon initially found support along the upper channel line after breaking out of its three-month trading range. I have circled this to better illustrate it. You also had the black median line coming into play, which indicated significant support around the $51.00 level. When Devon failed to hold this level the second time around (earlier this month), it was a sign of further weakness. |
| More specifically, notice how the bottom black parallel line came into play the second time around. Since this uptrend line intersected with the top channel line, the $51.00 level should have acted as ultimate support during the recent correction. As you can see, the stock failed to hold support here and has now breached the green median line. Even though Devon is oversold on the daily chart, a breach of its 200-day moving average could lead to a test of further support in the $45.50 to $46.50 range. |
Kevin has been a technical analyst for roughly 10 years now. Previously, Kevin owned his own business and acted as a registered investment advisor, specializing in energy. He was also a freelance oil analyst for Orient Trading Co., a commodity futures trading firm in Japan. Kevin is currently a freelance writer.
| Glen Allen, VA | |
| E-mail address: | hopson_1@yahoo.com |
Click here for more information about our publications!
PRINT THIS ARTICLE

Request Information From Our Sponsors
- StockCharts.com, Inc.
- Candle Patterns
- Candlestick Charting Explained
- Intermarket Technical Analysis
- John Murphy on Chart Analysis
- John Murphy's Chart Pattern Recognition
- John Murphy's Market Message
- MurphyExplainsMarketAnalysis-Intermarket Analysis
- MurphyExplainsMarketAnalysis-Visual Analysis
- StockCharts.com
- Technical Analysis of the Financial Markets
- The Visual Investor
- VectorVest, Inc.
- Executive Premier Workshop
- One-Day Options Course
- OptionsPro
- Retirement Income Workshop
- Sure-Fire Trading Systems (VectorVest, Inc.)
- Trading as a Business Workshop
- VectorVest 7 EOD
- VectorVest 7 RealTime/IntraDay
- VectorVest AutoTester
- VectorVest Educational Services
- VectorVest OnLine
- VectorVest Options Analyzer
- VectorVest ProGraphics v6.0
- VectorVest ProTrader 7
- VectorVest RealTime Derby Tool
- VectorVest Simulator
- VectorVest Variator
- VectorVest Watchdog
