HOT TOPICS LIST
- MACD
- Fibonacci
- RSI
- Gann
- ADXR
- Stochastics
- Volume
- Triangles
- Futures
- Cycles
- Volatility
- ZIGZAG
- MESA
- Retracement
- Aroon
INDICATORS LIST
LIST OF TOPICS
PRINT THIS ARTICLE
by Andrew Hetherington
Now is a good time to buy into this stock as it breaks out of an ascending triangle formation.
Position: N/A
Andrew Hetherington
Classic Dow Theorist who trades as a pure technician, using pattern recognition.
PRINT THIS ARTICLE
CHART ANALYSIS
Citigroup Incorporated Helps Fuel the Financials
07/17/03 08:43:02 AMby Andrew Hetherington
Now is a good time to buy into this stock as it breaks out of an ascending triangle formation.
Position: N/A
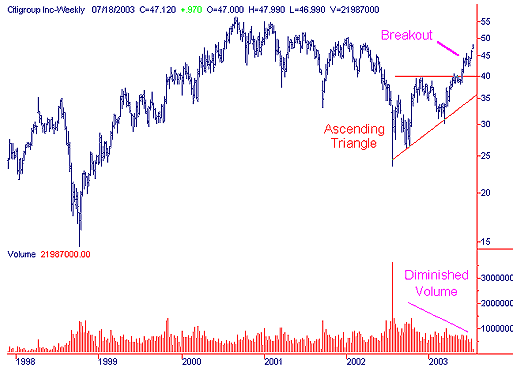
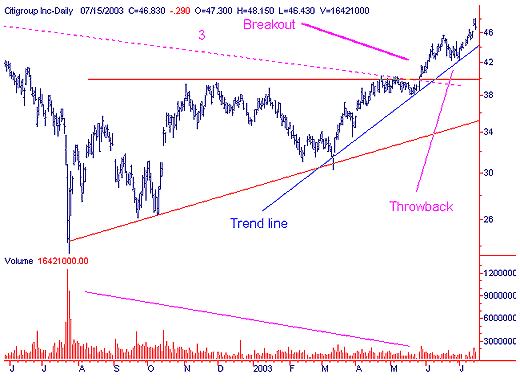
 Figure 1: Weekly chart of Citigroup. On the weekly chart we have Citigroup (C) forming an 11-month ascending triangle. The volume on this pattern is nicely diminished from left to right. This is a reversal triangle although some might consider it a consolidation triangle. It has broken through the third fan line with an increase in volume, which coincides with the breakout from the triangle. There is the standard hesitation or throwback to the trendline as is often the case, and this is your buy in point. This confirmation on increased volume, which diminishes on the throwback and holds the trendline, is your signal that the equity is just taking a breather before lurching for new highs. |

|
| Figure 2: Daily chart of Citigroup. |
| Graphic provided by: SuperCharts. |
| |
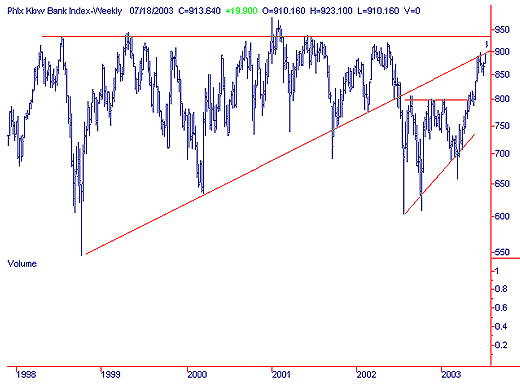
| As is the case with many Dow components, these equities sometimes mirror the index itself, in particular the financials. As illustrated in the BKX Index chart there is a definite similarity between Citigroup, BKX and the Dow. Although, these aren't exact replicas, it is worth keeping an eye on when deciding to trade either of these equities or indices. As for the BKX, it looks ready to make all time highs above 977 since it gapped over the heavy resistance in the 900 areas. It is difficult to diagnose a gap without the use of volume as in the BKX Index, but it is my guess that this is a breakaway gap, which will propel the index higher. |
 Figure 3: BKX Index. |
Classic Dow Theorist who trades as a pure technician, using pattern recognition.
| Toronto, Canada |
Click here for more information about our publications!
Comments
Date: 07/17/03Rank: 4Comment:

Request Information From Our Sponsors
- StockCharts.com, Inc.
- Candle Patterns
- Candlestick Charting Explained
- Intermarket Technical Analysis
- John Murphy on Chart Analysis
- John Murphy's Chart Pattern Recognition
- John Murphy's Market Message
- MurphyExplainsMarketAnalysis-Intermarket Analysis
- MurphyExplainsMarketAnalysis-Visual Analysis
- StockCharts.com
- Technical Analysis of the Financial Markets
- The Visual Investor
- VectorVest, Inc.
- Executive Premier Workshop
- One-Day Options Course
- OptionsPro
- Retirement Income Workshop
- Sure-Fire Trading Systems (VectorVest, Inc.)
- Trading as a Business Workshop
- VectorVest 7 EOD
- VectorVest 7 RealTime/IntraDay
- VectorVest AutoTester
- VectorVest Educational Services
- VectorVest OnLine
- VectorVest Options Analyzer
- VectorVest ProGraphics v6.0
- VectorVest ProTrader 7
- VectorVest RealTime Derby Tool
- VectorVest Simulator
- VectorVest Variator
- VectorVest Watchdog
