HOT TOPICS LIST
- MACD
- Fibonacci
- RSI
- Gann
- ADXR
- Stochastics
- Volume
- Triangles
- Futures
- Cycles
- Volatility
- ZIGZAG
- MESA
- Retracement
- Aroon
INDICATORS LIST
LIST OF TOPICS
PRINT THIS ARTICLE
by Gary Grosschadl
The weekly chart shows upside potential.
Position: N/A
Gary Grosschadl
Independent Canadian equities trader and technical analyst based in Peterborough
Ontario, Canada.
PRINT THIS ARTICLE
CHART ANALYSIS
S&P 500 Upside Targets
07/14/03 02:04:52 PMby Gary Grosschadl
The weekly chart shows upside potential.
Position: N/A
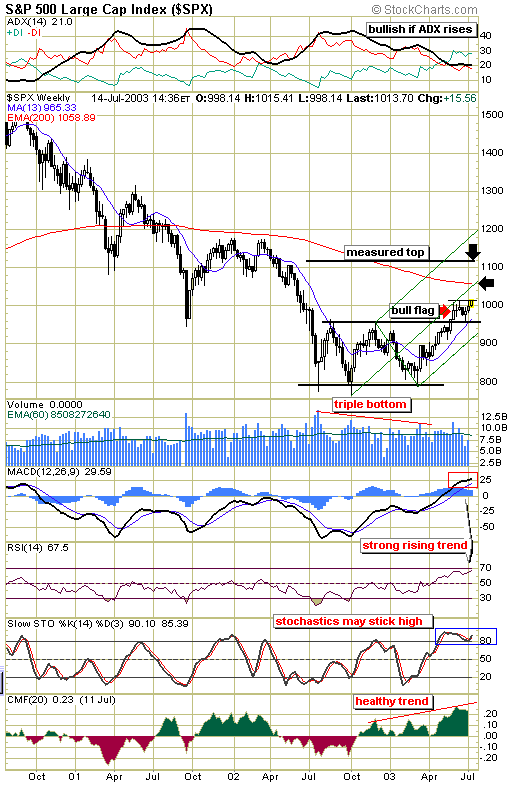
| This broader market index has been showing good strength since moving off its previous low. I am tempted to call it a triple bottom as the weekly chart shows. As this formation developed the volume trend confirmed a bottom and subsequent bottom tests occured with less volume, showing less conviction on the part of the bears. |
| Since this index surged past the 950 mark, it has formed a bullish flag as it teased the 1000+ level. A move past this flag has repercussions either way. Right now it looks like there is a good chance of an upside break. If so then the chart shows two upside targets. |

|
| S&P 500 weekly chart. |
| Graphic provided by: Stockcharts.com. |
| |
| The first target is the 200-period EMA which also happens to lie in the area of the pitchfork median line. The pitchfork or Andrews Line method shows a good progression between the middle and lower forks with a touch of the median line. Often a touch of the median line brings a reversal and in this case it was a bullish consolidation that formed the flag pattern. A move higher from here carries the bullish potential of another move to test the same median line at a higher level. This would take us to the first target area. |
| A successful test at the 200-period EMA target area would bring the next higher target into the picture and that is the measured pattern fulfillment of the triple bottom reversal. This 1120 area is the distance from the triple bottom to the trough line as applied to the upside move. |
| The displayed indicators show good trend strength via the rising MACD and RSI. In strongly trending markets non-trending oscillators such as stochastics may stick high for extended periods. The ADX line must climb higher from its present level (directional movement graph at top of chart) to show enough trend strength to keep this index rising higher. Watch for a convincing break of this flag formation as a short-term guide going forward. |
Independent Canadian equities trader and technical analyst based in Peterborough
Ontario, Canada.
| Website: | www.whatsonsale.ca/financial.html |
| E-mail address: | gwg7@sympatico.ca |
Click here for more information about our publications!
Comments
Date: 07/15/03Rank: 4Comment:

Request Information From Our Sponsors
- StockCharts.com, Inc.
- Candle Patterns
- Candlestick Charting Explained
- Intermarket Technical Analysis
- John Murphy on Chart Analysis
- John Murphy's Chart Pattern Recognition
- John Murphy's Market Message
- MurphyExplainsMarketAnalysis-Intermarket Analysis
- MurphyExplainsMarketAnalysis-Visual Analysis
- StockCharts.com
- Technical Analysis of the Financial Markets
- The Visual Investor
- VectorVest, Inc.
- Executive Premier Workshop
- One-Day Options Course
- OptionsPro
- Retirement Income Workshop
- Sure-Fire Trading Systems (VectorVest, Inc.)
- Trading as a Business Workshop
- VectorVest 7 EOD
- VectorVest 7 RealTime/IntraDay
- VectorVest AutoTester
- VectorVest Educational Services
- VectorVest OnLine
- VectorVest Options Analyzer
- VectorVest ProGraphics v6.0
- VectorVest ProTrader 7
- VectorVest RealTime Derby Tool
- VectorVest Simulator
- VectorVest Variator
- VectorVest Watchdog
