HOT TOPICS LIST
- MACD
- Fibonacci
- RSI
- Gann
- ADXR
- Stochastics
- Volume
- Triangles
- Futures
- Cycles
- Volatility
- ZIGZAG
- MESA
- Retracement
- Aroon
INDICATORS LIST
LIST OF TOPICS
PRINT THIS ARTICLE
by Andrew Hetherington
Technicians love it: A bottom reversal pattern without any complications.
Position: N/A
Andrew Hetherington
Classic Dow Theorist who trades as a pure technician, using pattern recognition.
PRINT THIS ARTICLE
CHART ANALYSIS
Nortel Network is Moving Higher
07/15/03 10:47:23 AMby Andrew Hetherington
Technicians love it: A bottom reversal pattern without any complications.
Position: N/A
 Figure 1: Daily chart of Nortel Networks. A 7-month bottom reversal-ascending triangle has formed on Nortel's daily chart. The volume is near-perfect and the breakout is strong, occurring from May 2nd to May 7th. The breakout was in the $2.70 area and there was the standard throwback to the line before resuming the up move once again. It ran as high as $3.55 on June 6th and threw back to the line in the $2.70 area at the beginning of July. |
| This move is accompanied by good chart behavior, meaning higher volume going up and diminished activity on the downward moves. Seasoned technicians love this style of chart since it allows them to more accurately predict up moves. I've long had the opinion that selecting long positions is more difficult than selecting short positions. When things are bad everything is affected. However, once again I must say that it takes money to drive the equities higher. |

|
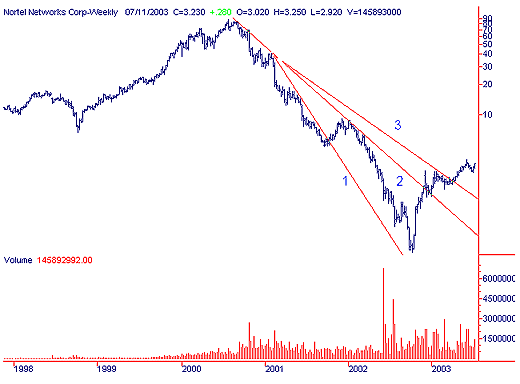
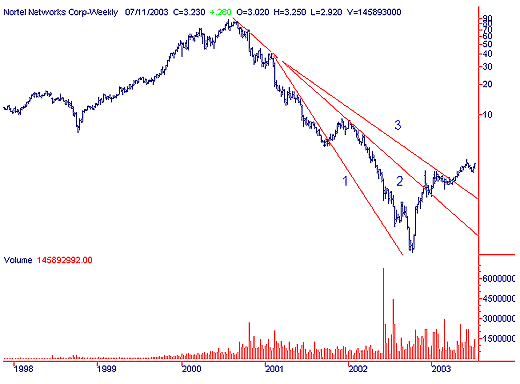
| Figure 2: Weekly chart of Nortel Networks. |
| Graphic provided by: SuperCharts. |
| |
| On the weekly chart notice that the long-term downtrend was broken on increased volume last November. The reversal pattern formed and it is now ready to resume its reversal. The near-term prognostication is in the $5.00 area and the longer-term resistance is in the $9.00 area. This is a good medium to long-term equity to have in your 401K once again. |
Classic Dow Theorist who trades as a pure technician, using pattern recognition.
| Toronto, Canada |
Click here for more information about our publications!
PRINT THIS ARTICLE

|

Request Information From Our Sponsors
- StockCharts.com, Inc.
- Candle Patterns
- Candlestick Charting Explained
- Intermarket Technical Analysis
- John Murphy on Chart Analysis
- John Murphy's Chart Pattern Recognition
- John Murphy's Market Message
- MurphyExplainsMarketAnalysis-Intermarket Analysis
- MurphyExplainsMarketAnalysis-Visual Analysis
- StockCharts.com
- Technical Analysis of the Financial Markets
- The Visual Investor
- VectorVest, Inc.
- Executive Premier Workshop
- One-Day Options Course
- OptionsPro
- Retirement Income Workshop
- Sure-Fire Trading Systems (VectorVest, Inc.)
- Trading as a Business Workshop
- VectorVest 7 EOD
- VectorVest 7 RealTime/IntraDay
- VectorVest AutoTester
- VectorVest Educational Services
- VectorVest OnLine
- VectorVest Options Analyzer
- VectorVest ProGraphics v6.0
- VectorVest ProTrader 7
- VectorVest RealTime Derby Tool
- VectorVest Simulator
- VectorVest Variator
- VectorVest Watchdog
