HOT TOPICS LIST
- MACD
- Fibonacci
- RSI
- Gann
- ADXR
- Stochastics
- Volume
- Triangles
- Futures
- Cycles
- Volatility
- ZIGZAG
- MESA
- Retracement
- Aroon
INDICATORS LIST
LIST OF TOPICS
PRINT THIS ARTICLE
by Andrew Hetherington
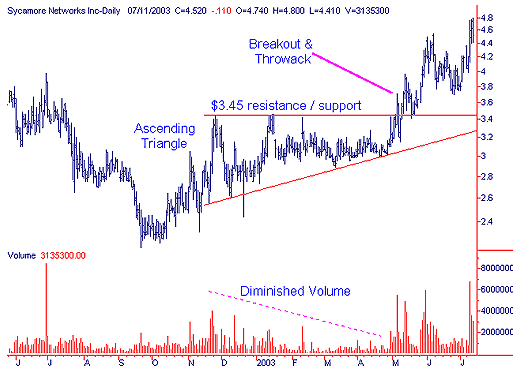
Like so many other stocks, Sycamore Networks (SCMR) has bottomed out. A 7-month bottom reversal-ascending triangle has formed on their daily chart with perfect volume on the creation of the pattern.
Position: N/A
Andrew Hetherington
Classic Dow Theorist who trades as a pure technician, using pattern recognition.
PRINT THIS ARTICLE
CHART ANALYSIS
Sycamore Networks Has Seen the Light
07/14/03 10:27:07 AMby Andrew Hetherington
Like so many other stocks, Sycamore Networks (SCMR) has bottomed out. A 7-month bottom reversal-ascending triangle has formed on their daily chart with perfect volume on the creation of the pattern.
Position: N/A
 Figure 1: Daily chart of Sycamore Networks. Sycamore's breakout came in May through the resistance in the $3.45 area. There was the customary throwback to the buy point along the support at $3.45 and this was the best time to take a long position. If an opportunity presents itself and this equity comes off of its recent high of $4.80 down towards the support line of $3.45, it will be an excellent medium to long-term hold. The all-time low on this equity is $2.20 touched back in September of 2002, and we aren't that far off of the bottom to take a risk if we see a throwback. |
| The increased volume on this rally since the breakout illustrates the underlying strength of this equity. The volumes are steadily increasing accompanied with higher highs in price. This is a signal technicians like to see. It takes money to move equities higher but they can fall on their own weight. Investors sell for a variety of reasons but they all buy for the same reason-- the potential of higher prices. |

|
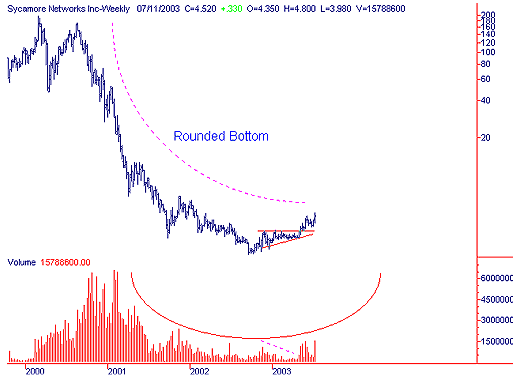
| Figure 2: Weekly chart of Sycamore Networks. |
| Graphic provided by: SuperCharts. |
| |
| Looking at the bigger picture I see a rounding bottom or rounding turn. The price movement and the volume have the same concave shape. Of course, I can't anticipate this equity to go back as high as it once was, however, higher prices compared to the bottom are likely. Down the road a price of $6.25 medium-term and much later $12.00 is a possibility. |
Classic Dow Theorist who trades as a pure technician, using pattern recognition.
| Toronto, Canada |
Click here for more information about our publications!
Comments
Date: 07/15/03Rank: 5Comment:
Date: 07/15/03Rank: 4Comment:
Date: 07/15/03Rank: 5Comment:

Request Information From Our Sponsors
- VectorVest, Inc.
- Executive Premier Workshop
- One-Day Options Course
- OptionsPro
- Retirement Income Workshop
- Sure-Fire Trading Systems (VectorVest, Inc.)
- Trading as a Business Workshop
- VectorVest 7 EOD
- VectorVest 7 RealTime/IntraDay
- VectorVest AutoTester
- VectorVest Educational Services
- VectorVest OnLine
- VectorVest Options Analyzer
- VectorVest ProGraphics v6.0
- VectorVest ProTrader 7
- VectorVest RealTime Derby Tool
- VectorVest Simulator
- VectorVest Variator
- VectorVest Watchdog
- StockCharts.com, Inc.
- Candle Patterns
- Candlestick Charting Explained
- Intermarket Technical Analysis
- John Murphy on Chart Analysis
- John Murphy's Chart Pattern Recognition
- John Murphy's Market Message
- MurphyExplainsMarketAnalysis-Intermarket Analysis
- MurphyExplainsMarketAnalysis-Visual Analysis
- StockCharts.com
- Technical Analysis of the Financial Markets
- The Visual Investor
