HOT TOPICS LIST
- MACD
- Fibonacci
- RSI
- Gann
- ADXR
- Stochastics
- Volume
- Triangles
- Futures
- Cycles
- Volatility
- ZIGZAG
- MESA
- Retracement
- Aroon
INDICATORS LIST
LIST OF TOPICS
PRINT THIS ARTICLE
by Kevin Hopson
Apache Corp. looks to be completing a bullish triangle formation, indicating a potential break to the upside. However, I would wait for confirmation before jumping in.
Position: Hold
Kevin Hopson
Kevin has been a technical analyst for roughly 10 years now. Previously, Kevin owned his own business and acted as a registered investment advisor, specializing in energy. He was also a freelance oil analyst for Orient Trading Co., a commodity futures trading firm in Japan. Kevin is currently a freelance writer.
PRINT THIS ARTICLE
TRIANGLES
Apache Corp. on the Verge of Breaking Out
07/14/03 11:37:19 AMby Kevin Hopson
Apache Corp. looks to be completing a bullish triangle formation, indicating a potential break to the upside. However, I would wait for confirmation before jumping in.
Position: Hold
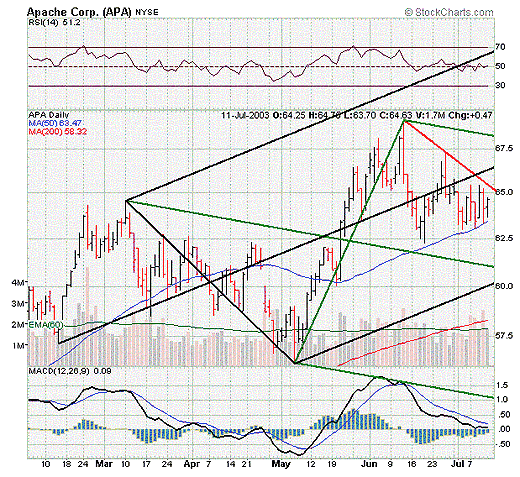
| Apache Corp. (APA) is an oil and natural gas exploration and production company with primary operations in the United States, Western Canada, offshore Western Australia and onshore and offshore Egypt. Over the last month, the stock has formed a pattern of lower highs and higher lows, also known as a triangle. This is illustrated in the six-month chart. More specifically, notice that June's downtrend line (red line) is acting as the top of the triangle (resistance), while Apache's 50-day moving average ($63.47) is acting as the bottom of the triangle (support). |
| Since symmetrical triangles tend to be continuation patterns and the long-term trend for Apache is positive, the stock should see a break to the upside in the near-term. However, I would play it safe in this instance and look for a breach of June's downtrend line before committing to the long side. More specifically, I would watch for a clear break of the $65.50 level on higher-than-normal volume for confirmation of this. |

|
| Graphic provided by: Stockcharts.com. |
| |
| If Apache does take out June's downtrend line, effectively breaking out of the bullish triangle formation, the stock should move above the $70.00 level in the long-term. In other words, the black median line ($66.50) and top green parallel line ($68.25) should only act as short-term resistance for the stock, eventually giving way to higher prices further down the road. However, if Apache proceeds to break support along its 50-day moving average, I would look for a possible pullback to the $60.00 to $61.00 range, site of the green median line and the bottom black parallel line. |
Kevin has been a technical analyst for roughly 10 years now. Previously, Kevin owned his own business and acted as a registered investment advisor, specializing in energy. He was also a freelance oil analyst for Orient Trading Co., a commodity futures trading firm in Japan. Kevin is currently a freelance writer.
| Glen Allen, VA | |
| E-mail address: | hopson_1@yahoo.com |
Click here for more information about our publications!
PRINT THIS ARTICLE

Request Information From Our Sponsors
- StockCharts.com, Inc.
- Candle Patterns
- Candlestick Charting Explained
- Intermarket Technical Analysis
- John Murphy on Chart Analysis
- John Murphy's Chart Pattern Recognition
- John Murphy's Market Message
- MurphyExplainsMarketAnalysis-Intermarket Analysis
- MurphyExplainsMarketAnalysis-Visual Analysis
- StockCharts.com
- Technical Analysis of the Financial Markets
- The Visual Investor
- VectorVest, Inc.
- Executive Premier Workshop
- One-Day Options Course
- OptionsPro
- Retirement Income Workshop
- Sure-Fire Trading Systems (VectorVest, Inc.)
- Trading as a Business Workshop
- VectorVest 7 EOD
- VectorVest 7 RealTime/IntraDay
- VectorVest AutoTester
- VectorVest Educational Services
- VectorVest OnLine
- VectorVest Options Analyzer
- VectorVest ProGraphics v6.0
- VectorVest ProTrader 7
- VectorVest RealTime Derby Tool
- VectorVest Simulator
- VectorVest Variator
- VectorVest Watchdog
