

HOT TOPICS LIST
- MACD
- Fibonacci
- RSI
- Gann
- ADXR
- Stochastics
- Volume
- Triangles
- Futures
- Cycles
- Volatility
- ZIGZAG
- MESA
- Retracement
- Aroon
INDICATORS LIST
LIST OF TOPICS
PRINT THIS ARTICLE
by Gary Grosschadl
This widely followed bell weather stock has trouble ahead if it dips below $28 and this is why.
Position: Sell
Gary Grosschadl
Independent Canadian equities trader and technical analyst based in Peterborough
Ontario, Canada.
PRINT THIS ARTICLE
Dim View For General Electric
07/11/03 08:15:29 AMby Gary Grosschadl
This widely followed bell weather stock has trouble ahead if it dips below $28 and this is why.
Position: Sell
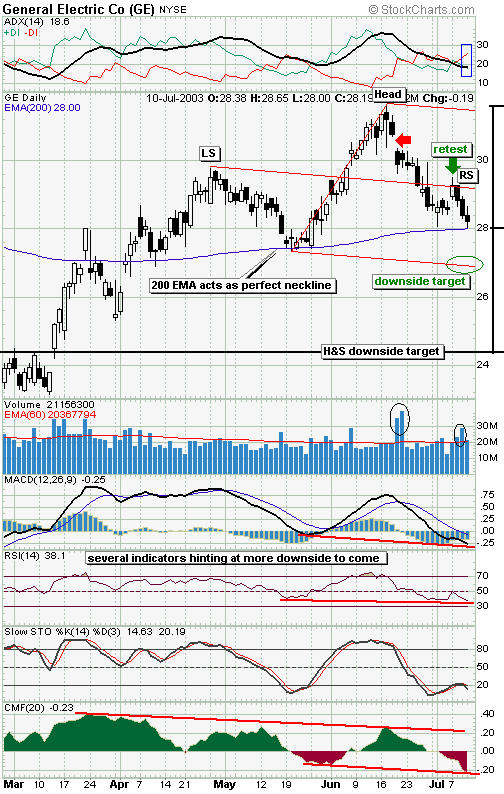
| Although not the prettiest pattern, it does look like GE may be putting in a head and shoulders reversal pattern. Especially poignant is that the ever powerful 200-day exponential moving average (EMA) is acting as the perfect neckline to this pattern. This longer-term moving average (in most cases I prefer this to the simple moving average) often points to major support/resistance as the case may be and this level is closely watched by many a trader and fund manager. |
| Volume plays an important part in adding validity to these patterns and there are two volume surges in the correct spots, the first one being an increase in volume during the decline from the head, as traders realize a top may be in. The second is a volume increase on the decline from the right shoulder where alert traders may already be fearing the chance of a head and shoulders reversal. The third volume area to watch closely will be a breakdown (if it comes) of the neckline which ideally should come with another large volume surge once $28 is cracked to the downside. |
|
| General Electric daily chart showing pitchfork view and a possible head and shoulders reversal threat. |
| Graphic provided by: Stockcharts.com. |
| |
| A pitchfork (median line method or Andrews Line) was put in to show some supporting evidence of a likely decline. When a pitchfork pattern shows a reversal or bounce off either the top or bottom tine, a move to the median line (center) is often the consequence. What happened then was a failure of the line to hold, which is added bearishness. The 200-day EMA then came in to offer support and a retest of the median line followed. The retest failed and now GE is back to the 200-day EMA where I'm concerned it won't hold. |
| A supporting cast of several indicators also point to the downside danger likelihood. The components of the directional movement indicator (ADX/DIs at the top of chart) have a bearish setup with ADX threatening to tick up with the DIs bearishly diverging. The other indicators below the chart seem to point to further downside ahead as they are lower than the previous time the stock touched the moving average, this being a form of negative divergence. |
| I am indicating two downside targets, the first being the lower pitchfork line which may offer support. Failure at or near the line may foretell the more serious downside target of the head and shoulders pattern fulfilling to completion at around $24.40. This is the measured move from the height of the head to the neckline, applied to the downside direction. A surprise move back up to the median line negates this bearish view for now but seems unlikely. |
Independent Canadian equities trader and technical analyst based in Peterborough
Ontario, Canada.
| Website: | www.whatsonsale.ca/financial.html |
| E-mail address: | gwg7@sympatico.ca |
Click here for more information about our publications!
PRINT THIS ARTICLE

Request Information From Our Sponsors
- StockCharts.com, Inc.
- Candle Patterns
- Candlestick Charting Explained
- Intermarket Technical Analysis
- John Murphy on Chart Analysis
- John Murphy's Chart Pattern Recognition
- John Murphy's Market Message
- MurphyExplainsMarketAnalysis-Intermarket Analysis
- MurphyExplainsMarketAnalysis-Visual Analysis
- StockCharts.com
- Technical Analysis of the Financial Markets
- The Visual Investor
- VectorVest, Inc.
- Executive Premier Workshop
- One-Day Options Course
- OptionsPro
- Retirement Income Workshop
- Sure-Fire Trading Systems (VectorVest, Inc.)
- Trading as a Business Workshop
- VectorVest 7 EOD
- VectorVest 7 RealTime/IntraDay
- VectorVest AutoTester
- VectorVest Educational Services
- VectorVest OnLine
- VectorVest Options Analyzer
- VectorVest ProGraphics v6.0
- VectorVest ProTrader 7
- VectorVest RealTime Derby Tool
- VectorVest Simulator
- VectorVest Variator
- VectorVest Watchdog