HOT TOPICS LIST
- MACD
- Fibonacci
- RSI
- Gann
- ADXR
- Stochastics
- Volume
- Triangles
- Futures
- Cycles
- Volatility
- ZIGZAG
- MESA
- Retracement
- Aroon
INDICATORS LIST
LIST OF TOPICS
PRINT THIS ARTICLE
by Gary Grosschadl
It's not hard to figure out who's leading the pack but are they leaders or going against the grain and due to expire?
Position: N/A
Gary Grosschadl
Independent Canadian equities trader and technical analyst based in Peterborough
Ontario, Canada.
PRINT THIS ARTICLE
CHART ANALYSIS
International Look at Indexes
07/10/03 08:56:21 AMby Gary Grosschadl
It's not hard to figure out who's leading the pack but are they leaders or going against the grain and due to expire?
Position: N/A
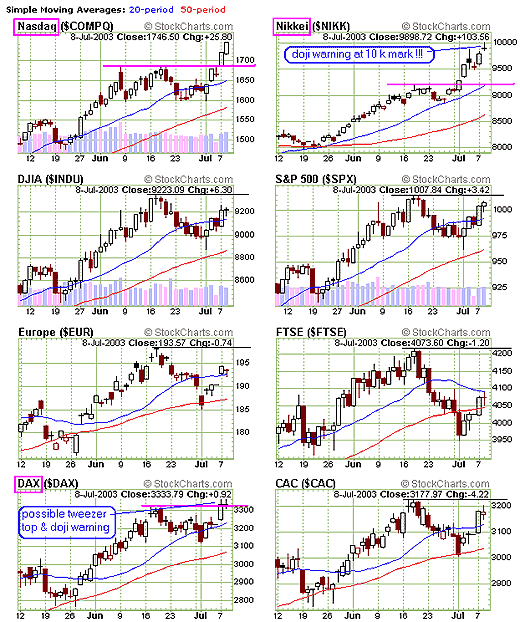
| Of the various indexes I track, only three are leading the way forward judging by this look at the daily charts. It is disconcerting that two of them are showing possible warning signs of a top or reversal. |
| The Japanese Nikkei has touched the important psychological mark of 10,000 but has done so with a doji candlestick. I have often shown how relevent dojis can be at extended tops and bottoms. At areas of extended runs either way, the small doji cross often marks a loss of momentum via the indecision of the bulls and bears. These can be powerful reversals at times or at least signal some downleg ahead. A move above the doji negates the bearish tone as the bulls reassert themselves. |

|
| Daily charts of various international indices. |
| Graphic provided by: Stockcharts.com. |
| |
| On the German Dax chart a possible tweezer top (think of the pincher action of adjacent top tails) and combination doji top warning have formed. The Dax may not be showing much leadership here as it is testing former recent highs, but it is the only main European index that I follow that is possibly topping out, and this may turn out to be a meaningful juncture. |
| From these charts I can surmise that the Nasdaq is the strongest looking in this short time frame. The big question is, if the other two "leaders" are balking and possibly topping out or reversing...can the Nasdaq go it alone from here? Not likely in my opinion. But the market will tell us soon enough. |
| The trend is your friend and until lower trendlines are violated, this recent bull remains intact. However this look suggests that lower trendlines could be soon tested and the true strength of the bull will be known. |
Independent Canadian equities trader and technical analyst based in Peterborough
Ontario, Canada.
| Website: | www.whatsonsale.ca/financial.html |
| E-mail address: | gwg7@sympatico.ca |
Click here for more information about our publications!
PRINT THIS ARTICLE

|

Request Information From Our Sponsors
- StockCharts.com, Inc.
- Candle Patterns
- Candlestick Charting Explained
- Intermarket Technical Analysis
- John Murphy on Chart Analysis
- John Murphy's Chart Pattern Recognition
- John Murphy's Market Message
- MurphyExplainsMarketAnalysis-Intermarket Analysis
- MurphyExplainsMarketAnalysis-Visual Analysis
- StockCharts.com
- Technical Analysis of the Financial Markets
- The Visual Investor
- VectorVest, Inc.
- Executive Premier Workshop
- One-Day Options Course
- OptionsPro
- Retirement Income Workshop
- Sure-Fire Trading Systems (VectorVest, Inc.)
- Trading as a Business Workshop
- VectorVest 7 EOD
- VectorVest 7 RealTime/IntraDay
- VectorVest AutoTester
- VectorVest Educational Services
- VectorVest OnLine
- VectorVest Options Analyzer
- VectorVest ProGraphics v6.0
- VectorVest ProTrader 7
- VectorVest RealTime Derby Tool
- VectorVest Simulator
- VectorVest Variator
- VectorVest Watchdog
