HOT TOPICS LIST
- MACD
- Fibonacci
- RSI
- Gann
- ADXR
- Stochastics
- Volume
- Triangles
- Futures
- Cycles
- Volatility
- ZIGZAG
- MESA
- Retracement
- Aroon
INDICATORS LIST
LIST OF TOPICS
PRINT THIS ARTICLE
by Gary Grosschadl
Canada's builder of planes, trains and recreational products has surged past the $5 mark with some conviction but it's a long way back to the old highs of $25.
Position: Buy
Gary Grosschadl
Independent Canadian equities trader and technical analyst based in Peterborough
Ontario, Canada.
PRINT THIS ARTICLE
CHART ANALYSIS
Bombardier Makes a Strong Move
07/11/03 02:13:03 PMby Gary Grosschadl
Canada's builder of planes, trains and recreational products has surged past the $5 mark with some conviction but it's a long way back to the old highs of $25.
Position: Buy
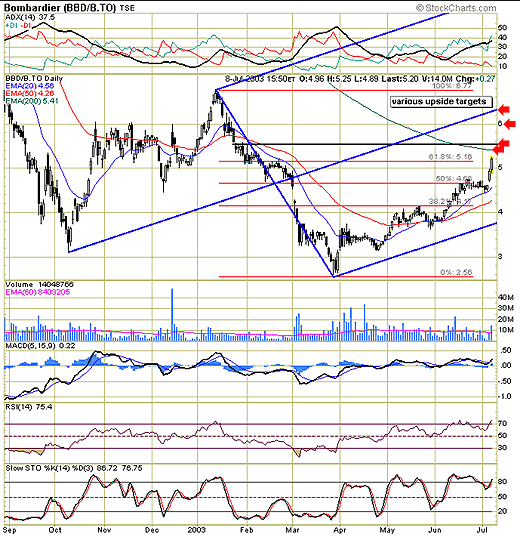
| This daily chart spanning 11 months shows how volatile this transportation stock has been. A large Andrews Line, more commonly known as a "pitchfork," shows how this last upleg has been contained. This method of drawing parallel lines based on major pivots or turning points shows a nice parallel path upwards between the center and lower median lines. The hallmarks of this technique involves travel near one of the pitchfork tines and often a move to the center median line. With a very bullish drive upwards the ideal target would be the area above $6.30. |
| The red arrows show several possible upside targets before the median line target. The nearest target or resistance test is the 200-day EMA, currently $5.41. Just beyond that is a previous gap and congestion area around $5.50. The $6 area may also pose likely resistance as it has been tested five times in the past. |

|
| Daily chart for Bombardier. |
| Graphic provided by: Stockcharts.com. |
| |
| The chart also outlines the common Fibonacci retracement levels. Since the stock closed at $5.20, above the 61.8% level of $5.16, this would hint at further bullish upside. Note the powerful bounce off the 20-day EMA which resulted in the launch past the 50% and 61.8% levels in three days. The gap move off that 20-day EMA level hinted at a powerful move developing. Stocks can make powerful retracement bounces off the 20-day moving averages and BBD.B shows a recent history of this. |
| Several indicators also offer clues to what may transpire. The directional movement indicator (top of chart) with its ADX and DI components show that this move still has upside room. The ADX line above 30 and sloping upwards shows strong directional strength. The ideal is to have the ADX line between both DIs with the +DI line above. This shows good bullish power that is not yet overheated and this is the case here. The MACD or moving average convergence/divergence shows a crossover above the zero line and this serves as another marker of good bullish strength. The other indicators, RSI and stochastics, show some caution may be warranted going forward as they have moved into possible oversold territory. However when stocks are in trending markets these oscillators can "stick" high for longer periods. |
| Recent action shows a powerful move underway. Look for either a reversal pattern or some consolidation at or near the areas outlined above. One possibility that makes sense would be a breather or consolidation close to the $5.50 with support from the 200-day EMA before another push higher towards the median line target. |
Independent Canadian equities trader and technical analyst based in Peterborough
Ontario, Canada.
| Website: | www.whatsonsale.ca/financial.html |
| E-mail address: | gwg7@sympatico.ca |
Click here for more information about our publications!
PRINT THIS ARTICLE

Request Information From Our Sponsors
- StockCharts.com, Inc.
- Candle Patterns
- Candlestick Charting Explained
- Intermarket Technical Analysis
- John Murphy on Chart Analysis
- John Murphy's Chart Pattern Recognition
- John Murphy's Market Message
- MurphyExplainsMarketAnalysis-Intermarket Analysis
- MurphyExplainsMarketAnalysis-Visual Analysis
- StockCharts.com
- Technical Analysis of the Financial Markets
- The Visual Investor
- VectorVest, Inc.
- Executive Premier Workshop
- One-Day Options Course
- OptionsPro
- Retirement Income Workshop
- Sure-Fire Trading Systems (VectorVest, Inc.)
- Trading as a Business Workshop
- VectorVest 7 EOD
- VectorVest 7 RealTime/IntraDay
- VectorVest AutoTester
- VectorVest Educational Services
- VectorVest OnLine
- VectorVest Options Analyzer
- VectorVest ProGraphics v6.0
- VectorVest ProTrader 7
- VectorVest RealTime Derby Tool
- VectorVest Simulator
- VectorVest Variator
- VectorVest Watchdog
