HOT TOPICS LIST
- MACD
- Fibonacci
- RSI
- Gann
- ADXR
- Stochastics
- Volume
- Triangles
- Futures
- Cycles
- Volatility
- ZIGZAG
- MESA
- Retracement
- Aroon
INDICATORS LIST
LIST OF TOPICS
PRINT THIS ARTICLE
by Kevin Hopson
Bearish divergences on the chart and a recent close below the 20-day moving average could indicate further downside potential for Denbury Resources in the near-term.
Position: Hold
Kevin Hopson
Kevin has been a technical analyst for roughly 10 years now. Previously, Kevin owned his own business and acted as a registered investment advisor, specializing in energy. He was also a freelance oil analyst for Orient Trading Co., a commodity futures trading firm in Japan. Kevin is currently a freelance writer.
PRINT THIS ARTICLE
TECHNICAL ANALYSIS
Is Denbury Resources Breaking Down?
07/08/03 09:20:28 AMby Kevin Hopson
Bearish divergences on the chart and a recent close below the 20-day moving average could indicate further downside potential for Denbury Resources in the near-term.
Position: Hold
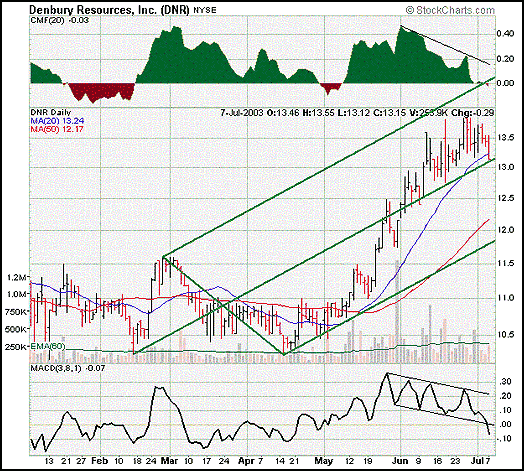
| I touched on Denbury Resources (DNR) just last week. More specifically, I said the chart was giving conflicting signals, making the near-term price direction difficult to predict. However, I did provide clues to help assist in determining which way the stock would break. For example, I noted that the moving average convergence/divergence (MACD) was putting in a pattern of lower highs and lower lows (falling channel), while the stock price was doing just the opposite. This is considered a bearish divergence, which indicated a possible break to the downside. |
| I also brought attention to the stock's 20-day moving average, which currently resides at the $13.24 level. Since Denbury had found continued support along its 20-day moving average since early May, I said that a breach of support here would likely confirm a break to the downside. As you can see in the six-month chart, Denbury closed below its 20-day moving average on Monday for the first time in two months. Additionally, the MACD has broken to the downside from its falling channel formation and the money flow has now turned negative. |

|
| Graphic provided by: Stockcharts.com. |
| |
| As a result, Denbury appears to be in the beginning stages of a more significant correction. However, a last sign of hope is the green pitchfork. More specifically, notice how the stock found support along the green median line on Monday. This median line has acted as a floor for prices since early June, meaning that a breach of support here will likely be the last straw. In other words, a pullback to the stock's 50-day moving average ($12.17) could be in the cards if this last level of support is taken out. |
Kevin has been a technical analyst for roughly 10 years now. Previously, Kevin owned his own business and acted as a registered investment advisor, specializing in energy. He was also a freelance oil analyst for Orient Trading Co., a commodity futures trading firm in Japan. Kevin is currently a freelance writer.
| Glen Allen, VA | |
| E-mail address: | hopson_1@yahoo.com |
Click here for more information about our publications!
PRINT THIS ARTICLE

Request Information From Our Sponsors
- StockCharts.com, Inc.
- Candle Patterns
- Candlestick Charting Explained
- Intermarket Technical Analysis
- John Murphy on Chart Analysis
- John Murphy's Chart Pattern Recognition
- John Murphy's Market Message
- MurphyExplainsMarketAnalysis-Intermarket Analysis
- MurphyExplainsMarketAnalysis-Visual Analysis
- StockCharts.com
- Technical Analysis of the Financial Markets
- The Visual Investor
- VectorVest, Inc.
- Executive Premier Workshop
- One-Day Options Course
- OptionsPro
- Retirement Income Workshop
- Sure-Fire Trading Systems (VectorVest, Inc.)
- Trading as a Business Workshop
- VectorVest 7 EOD
- VectorVest 7 RealTime/IntraDay
- VectorVest AutoTester
- VectorVest Educational Services
- VectorVest OnLine
- VectorVest Options Analyzer
- VectorVest ProGraphics v6.0
- VectorVest ProTrader 7
- VectorVest RealTime Derby Tool
- VectorVest Simulator
- VectorVest Variator
- VectorVest Watchdog
