HOT TOPICS LIST
- MACD
- Fibonacci
- RSI
- Gann
- ADXR
- Stochastics
- Volume
- Triangles
- Futures
- Cycles
- Volatility
- ZIGZAG
- MESA
- Retracement
- Aroon
INDICATORS LIST
LIST OF TOPICS
PRINT THIS ARTICLE
by David Penn
How the Dow Transports handle a nearby resistance level might tell investors all they need to know about the resilience of this bear market rally.
Position: N/A
David Penn
Technical Writer for Technical Analysis of STOCKS & COMMODITIES magazine, Working-Money.com, and Traders.com Advantage.
PRINT THIS ARTICLE
DOW THEORY
A Top in Transports?
07/07/03 07:57:27 AMby David Penn
How the Dow Transports handle a nearby resistance level might tell investors all they need to know about the resilience of this bear market rally.
Position: N/A
| While many Dow theorists are flitting their eyes back and forth between charts of the Dow Industrials and Dow Transports for signs of divergences, there is much to learn in studying the averages on their own first, and then comparing the analysis. Rather than trying to determine whether or not there is a divergence, analysts can determine whether the averages are bearish or bullish and then use that assessment to figure out what the bearishness or bullishness in one average says about the other. |
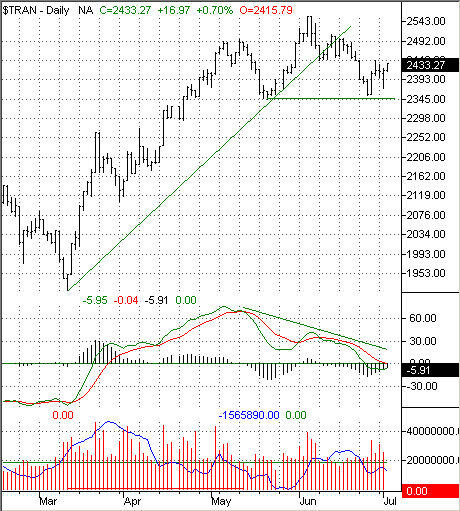
| Looking at the Dow Transports, there are a number of things that stand out. First is the trendline break in late May/early June. So far, while the Transports have broken the uptrend line that more or less tracks the entirety of the bull market since the March lows, they have yet to break down through support at approximately 2345. This support remains key for any upward movement in the Transports. On the other side of things, the 2492 level-- and beyond that the early June highs around 2555, are crucial resistance. Any successful move above these levels suggests that while the bull market that began in March might be leveling out somewhat, the uptrend would still be intact. The new relevant trough low would move from the May low to the June low for purposes of drawing the new trendline in this scenario. |

|
| A rally from a June break in the uptrend line could set the stage for a head and shoulders top in the Dow Jones Transportation Average ... and send bearish signals to the Industrials. |
| Graphic provided by: TradeStation. |
| |
| Another aspect of the Transportation Average since May is the negative divergence with the moving average convergence/divergence indicator (MACD). A negative divergence between price action and an indicator occurs when price action continues to advance higher, while the indicator is providing increasingly bearish signals. In the case of the MACD, increasingly bearish signals come as the indicator moves lower, particularly as it crosses the "zero line" and continues to drop. |
| The bearish case for the Transports would be further served if the volume oscillator began moving up-- particularly if the MACD continued to move down. Recently, I've noted how-- in a mature trend-- the combination of a rising volume oscillator combined with a falling MACD often anticipates a turn to the downside. While this has not yet occurred with the Transports, we can see the opposite (i.e., a falling volume oscillator combined with a rising MACD) in effect back in the spring. As prices began moving down in mid-March, the volume oscillator-- which had been rising-- began to peak and, by the end of the month, began to reverse to the downside. When the volume oscillator peaked on March 26th, the Dow Transports were at 2204. One month later, with the volume oscillator continuing to move downward, the Transports were up more than two hundred points. Note further that the trough low in the volume oscillator between March and July occurs about eight trading days before the price peak in the Dow Transports in early June. |
Technical Writer for Technical Analysis of STOCKS & COMMODITIES magazine, Working-Money.com, and Traders.com Advantage.
| Title: | Technical Writer |
| Company: | Technical Analysis, Inc. |
| Address: | 4757 California Avenue SW |
| Seattle, WA 98116 | |
| Phone # for sales: | 206 938 0570 |
| Fax: | 206 938 1307 |
| Website: | www.Traders.com |
| E-mail address: | DPenn@traders.com |
Traders' Resource Links | |
| Charting the Stock Market: The Wyckoff Method -- Books | |
| Working-Money.com -- Online Trading Services | |
| Traders.com Advantage -- Online Trading Services | |
| Technical Analysis of Stocks & Commodities -- Publications and Newsletters | |
| Working Money, at Working-Money.com -- Publications and Newsletters | |
| Traders.com Advantage -- Publications and Newsletters | |
| Professional Traders Starter Kit -- Software | |
Click here for more information about our publications!
Comments
Date: 07/08/03Rank: 5Comment:

Request Information From Our Sponsors
- StockCharts.com, Inc.
- Candle Patterns
- Candlestick Charting Explained
- Intermarket Technical Analysis
- John Murphy on Chart Analysis
- John Murphy's Chart Pattern Recognition
- John Murphy's Market Message
- MurphyExplainsMarketAnalysis-Intermarket Analysis
- MurphyExplainsMarketAnalysis-Visual Analysis
- StockCharts.com
- Technical Analysis of the Financial Markets
- The Visual Investor
- VectorVest, Inc.
- Executive Premier Workshop
- One-Day Options Course
- OptionsPro
- Retirement Income Workshop
- Sure-Fire Trading Systems (VectorVest, Inc.)
- Trading as a Business Workshop
- VectorVest 7 EOD
- VectorVest 7 RealTime/IntraDay
- VectorVest AutoTester
- VectorVest Educational Services
- VectorVest OnLine
- VectorVest Options Analyzer
- VectorVest ProGraphics v6.0
- VectorVest ProTrader 7
- VectorVest RealTime Derby Tool
- VectorVest Simulator
- VectorVest Variator
- VectorVest Watchdog
