HOT TOPICS LIST
- MACD
- Fibonacci
- RSI
- Gann
- ADXR
- Stochastics
- Volume
- Triangles
- Futures
- Cycles
- Volatility
- ZIGZAG
- MESA
- Retracement
- Aroon
INDICATORS LIST
LIST OF TOPICS
PRINT THIS ARTICLE
by Gary Grosschadl
Boeing apparently has found support at its 20-day exponential moving average.
Position: Buy
Gary Grosschadl
Independent Canadian equities trader and technical analyst based in Peterborough
Ontario, Canada.
PRINT THIS ARTICLE
CHART ANALYSIS
Boeing Cruises Down to Support
07/07/03 09:59:49 AMby Gary Grosschadl
Boeing apparently has found support at its 20-day exponential moving average.
Position: Buy
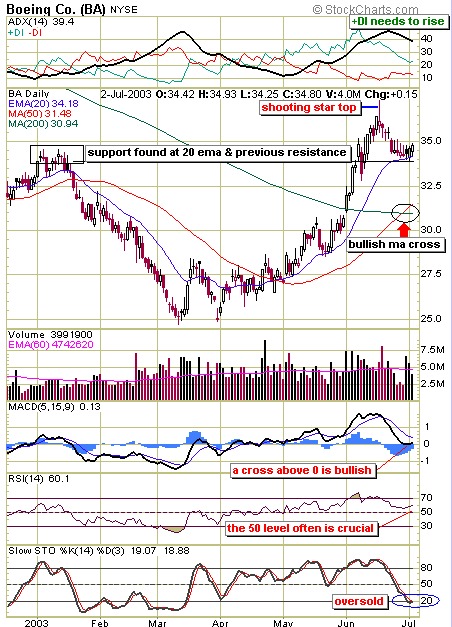
| After bottoming at $25, this airline stock soared to new heights until it halted at $37 with the formation of a shooting star. Support briefly held at $35 but the weight of negativity from several bearish candles led to a further decline. These bearish candles took the shape of a hanging man candle followed by two doji candlesticks. The shooting star is a top warning with its long upper shadow and the hanging man candle that followed (with its long lower shadow) is a similar bearish signal after extended advances. The doji candles (those having bodies shaped like small crosses with the same open and close), represent indecision or a loss of momentum at the end of declines and advances. Looking back on the chart, several dojis can be spotted marking various reversals. |
| Support at this level looks good for multiple reasons. Note how well the 20-day EMA has held support and resistance in the past. This current support area also coincides with a previous congestion area from early 2003. This was also acting as previous resistance. Often on charts in general, we find previous support and resistance come into play again down the road. Charts, like traders, have memory it seems. |

|
| Boeing's daily chart. |
| Graphic provided by: Stockcharts.com. |
| |
| Moving average crossovers are often deemed noteworthy and the 50/200-period crossovers are often looked for in scanning software tools. This combination is often a superior trading heads up and here is a good example. The fact that this crossover is happening at a possible retracement level makes for a much safer entry position versus chasing an advancing stock. |
| Other indicators worth noting are displayed on the chart. The most bullish is the MACD which shows a turn in the making which hints at the possibility of a bullish cross above the zero line, and the RSI turning above the 50 level. The other indicators need to show more improvement, namely the +DI component (top of chart) needs to rise above the black ADX line and stochastics indicator needs to rise above the 20 level. Typically when stocks are oversold, technical traders watch for stochastics to rise above 20 as a bullish signal of an upleg starting. |
| In order to show promise, BA first has to beat resistance at $35. This has the potential of being an early stall point so more prudent traders may want to see a close above that level before going long. |
Independent Canadian equities trader and technical analyst based in Peterborough
Ontario, Canada.
| Website: | www.whatsonsale.ca/financial.html |
| E-mail address: | gwg7@sympatico.ca |
Click here for more information about our publications!
Comments
Date: 07/08/03Rank: 5Comment:

|

Request Information From Our Sponsors
- VectorVest, Inc.
- Executive Premier Workshop
- One-Day Options Course
- OptionsPro
- Retirement Income Workshop
- Sure-Fire Trading Systems (VectorVest, Inc.)
- Trading as a Business Workshop
- VectorVest 7 EOD
- VectorVest 7 RealTime/IntraDay
- VectorVest AutoTester
- VectorVest Educational Services
- VectorVest OnLine
- VectorVest Options Analyzer
- VectorVest ProGraphics v6.0
- VectorVest ProTrader 7
- VectorVest RealTime Derby Tool
- VectorVest Simulator
- VectorVest Variator
- VectorVest Watchdog
- StockCharts.com, Inc.
- Candle Patterns
- Candlestick Charting Explained
- Intermarket Technical Analysis
- John Murphy on Chart Analysis
- John Murphy's Chart Pattern Recognition
- John Murphy's Market Message
- MurphyExplainsMarketAnalysis-Intermarket Analysis
- MurphyExplainsMarketAnalysis-Visual Analysis
- StockCharts.com
- Technical Analysis of the Financial Markets
- The Visual Investor
