HOT TOPICS LIST
- MACD
- Fibonacci
- RSI
- Gann
- ADXR
- Stochastics
- Volume
- Triangles
- Futures
- Cycles
- Volatility
- ZIGZAG
- MESA
- Retracement
- Aroon
INDICATORS LIST
LIST OF TOPICS
PRINT THIS ARTICLE
by Matt Blackman
It's been a good run since March 11 for the major indexes. They recently moved from overbought into oversold on the daily charts without the serious meltdown that many were expecting. Here is what two popular analytic tools can tell us and why this time it just might be the real thing.
Position: N/A
Matt Blackman
Matt Blackman is a full-time technical and financial writer and trader. He produces corporate and financial newsletters, and assists clients in getting published in the mainstream media. He is the host of TradeSystemGuru.com. Matt has earned the Chartered Market Technician (CMT) designation. Find out what stocks and futures Matt is watching on Twitter at www.twitter.com/RatioTrade
PRINT THIS ARTICLE
FIBONACCI
What Can Fibonacci and Candlesticks Tell Us About This Rally?
07/08/03 09:18:37 AMby Matt Blackman
It's been a good run since March 11 for the major indexes. They recently moved from overbought into oversold on the daily charts without the serious meltdown that many were expecting. Here is what two popular analytic tools can tell us and why this time it just might be the real thing.
Position: N/A
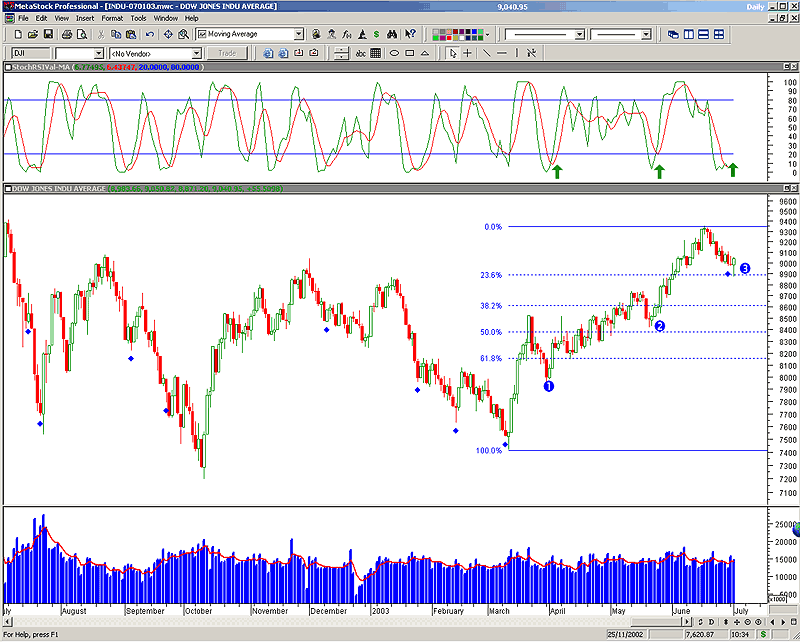
| Between September 2000 and March 2003, there have been five bear rallies to trick investors and some traders into believing that the bottom had come and gone. Just as they let their guard down, a meltdown occurred as the bears roared in to separate hopeful bulls from their money. This time however, the rally has been more orderly and the retracements have been decreasing in amplitude, suggesting that if anything, the bulls are gaining support. |
| An orderly and sustainable rally is one in which the market moves up for a few days, takes a step or two backwards, and then continues moving up again. Fibonacci retracements of 23.8, 31.8 or 50% show that there is inherent strength. But when the retracements get larger so that instead of taking three steps forward and one back, its two steps forward and two back, the rally is weakening and in danger of failure. |

|
| Figure 1 – Daily chart of the Dow Jones Industrial Average (INDU) showing Fibonacci retracements since March 11. The first move (1) retraced 50%, the second and third just 23.8%. The green arrows show the stochasticRSI buy signals. The blue diamonds are buy signals generated by the MetaStock Nison Candlesticks Unleashed (NCU) plug-in used as a default template by the author. Note the bullish engulfing bull/hammer candlestick pattern beside 3. |
| Graphic provided by: MetaStock. |
| |
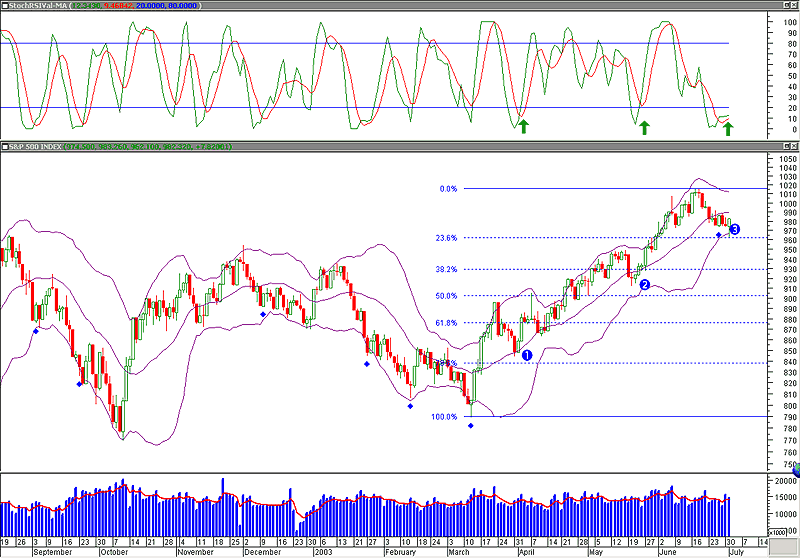
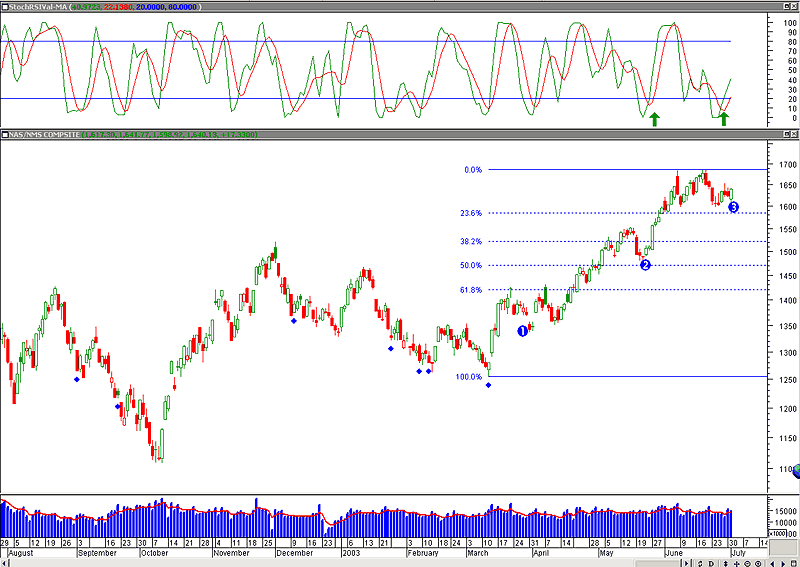
 Figure 2 - Daily chart of the S&P500 index (SPX) showing a strikingly similar pattern of advancement to the INDU. It has experienced similar advancements, retracements as well as buy signals but the engulfing bull/hammer was more pronounced.  Figure 3 - Daily of the Nasdaq Composite Index (IXIC) with similar moves but fewer buy signals than Figures 1-2. However, retracements 1, 2 and 3 were almost identical to the other two indexes as was the last candlestick pattern on the chart (3). The fact that all three indexes are in agreement shows that the rally is broad-based and encompasses a wide range of sectors. |
| Retracements, followed by increasing volume on the upside moves, show that players are using them to take long positions. The fact that the retracements are diminishing in amplitude (3<2 and 2<1) shows that buyers are becoming more eager to jump in with each pullback. One thing to watch out for is that volume diminished on the last move up on each chart. The technician prefers to see volume increasing on subsequent upside moves since declining volume signifies waning interest by buyers. It will also be critical that earnings and economic news in the coming weeks provide buyers with good reason to keep on buying or the bears will sense weakness and start to move back in for the kill. If this begins to happen, the levels of retracement on each pullback and accompanying candlestick patterns will give them away for those who know how to read them. |
Matt Blackman is a full-time technical and financial writer and trader. He produces corporate and financial newsletters, and assists clients in getting published in the mainstream media. He is the host of TradeSystemGuru.com. Matt has earned the Chartered Market Technician (CMT) designation. Find out what stocks and futures Matt is watching on Twitter at www.twitter.com/RatioTrade
| Company: | TradeSystemGuru.com |
| Address: | Box 2589 |
| Garibaldi Highlands, BC Canada | |
| Phone # for sales: | 604-898-9069 |
| Fax: | 604-898-9069 |
| Website: | www.tradesystemguru.com |
| E-mail address: | indextradermb@gmail.com |
Traders' Resource Links | |
| TradeSystemGuru.com has not added any product or service information to TRADERS' RESOURCE. | |
Click here for more information about our publications!
Comments
Date: 07/14/03Rank: 5Comment: very informative and insightful

Request Information From Our Sponsors
- VectorVest, Inc.
- Executive Premier Workshop
- One-Day Options Course
- OptionsPro
- Retirement Income Workshop
- Sure-Fire Trading Systems (VectorVest, Inc.)
- Trading as a Business Workshop
- VectorVest 7 EOD
- VectorVest 7 RealTime/IntraDay
- VectorVest AutoTester
- VectorVest Educational Services
- VectorVest OnLine
- VectorVest Options Analyzer
- VectorVest ProGraphics v6.0
- VectorVest ProTrader 7
- VectorVest RealTime Derby Tool
- VectorVest Simulator
- VectorVest Variator
- VectorVest Watchdog
- StockCharts.com, Inc.
- Candle Patterns
- Candlestick Charting Explained
- Intermarket Technical Analysis
- John Murphy on Chart Analysis
- John Murphy's Chart Pattern Recognition
- John Murphy's Market Message
- MurphyExplainsMarketAnalysis-Intermarket Analysis
- MurphyExplainsMarketAnalysis-Visual Analysis
- StockCharts.com
- Technical Analysis of the Financial Markets
- The Visual Investor
