HOT TOPICS LIST
- MACD
- Fibonacci
- RSI
- Gann
- ADXR
- Stochastics
- Volume
- Triangles
- Futures
- Cycles
- Volatility
- ZIGZAG
- MESA
- Retracement
- Aroon
INDICATORS LIST
LIST OF TOPICS
PRINT THIS ARTICLE
by Gary Grosschadl
After a very good run this index has retraced and now the previous bull run may resume.
Position: N/A
Gary Grosschadl
Independent Canadian equities trader and technical analyst based in Peterborough
Ontario, Canada.
PRINT THIS ARTICLE
CHART ANALYSIS
Oil Index Shows Possible Bottom Hammer
07/03/03 09:16:06 AMby Gary Grosschadl
After a very good run this index has retraced and now the previous bull run may resume.
Position: N/A
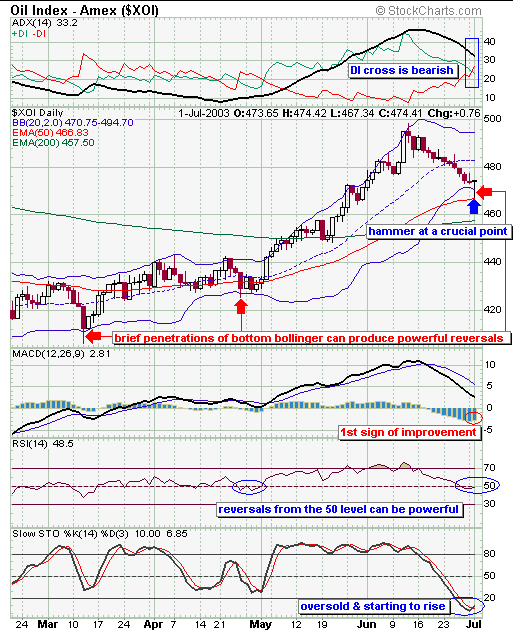
| The Oil Index is composed of 13 large oil companies currently trading between $16 and $72. After enduring a three week retracement, a possible reversal candle pattern (hammer bottom) has just occured. Confirmation is normally required for hammers, so look for a possible move up from here which would act as bullish confirmation. |
| What makes this hammer more compelling is its location. It has occured at the 50-day EMA and at the bottom Bollinger Band, giving some credence to a bounce possibility here. Developed by John Bollinger, Bollinger Bands allow users to compare volatility and relative price levels over a period of time. One way I like to use this indicator is to look for possible bottom reversals when the bottom Bollinger Band is briefly penetrated. This has just occured via the long tail of the hammer candle. Looking back at the previous times this has happened, we can see good uplegs soon followed. Note that stochastic turns from low levels launched those previous uplegs and now the same pattern may occur again. Watch for stochastics to rise above 20 as additional confirmation of a likely upleg. |

|
| Figure 1: Oil Index daily chart. |
| Graphic provided by: Stockcharts.com. |
| |
| The directional movement indicator at the top of the chart shows a bearish event via a DI crossover. This is a reminder that it is important that this hammer actually confirms to the upside, otherwise the downtrend could continue. The MACD (moving average convergence/divergence) is another trend strength indicator that advises caution as it has yet to turn up. However looking closely at its histogram, it has improved for the first time since this retracement began and this hints that the MACD line is ready to turn bullishly up. |
| This hammer with bullish confirmation in the next few days could signal the start of another upleg. The initial resistance line to watch would be the middle Bollinger line which is the 20-day SMA or simple moving average. |
Independent Canadian equities trader and technical analyst based in Peterborough
Ontario, Canada.
| Website: | www.whatsonsale.ca/financial.html |
| E-mail address: | gwg7@sympatico.ca |
Click here for more information about our publications!
Comments
Date: 12/27/03Rank: 4Comment: 1- WHER THE CRUDE OIL MARKET LOCATED
2- HOW IT WORKS
3-IS IT POSSIBLE TO TRADE IN IT.
4- WHICH BROKERS HAS THE RIGHTS TO TRADE ON IT.

Request Information From Our Sponsors
- StockCharts.com, Inc.
- Candle Patterns
- Candlestick Charting Explained
- Intermarket Technical Analysis
- John Murphy on Chart Analysis
- John Murphy's Chart Pattern Recognition
- John Murphy's Market Message
- MurphyExplainsMarketAnalysis-Intermarket Analysis
- MurphyExplainsMarketAnalysis-Visual Analysis
- StockCharts.com
- Technical Analysis of the Financial Markets
- The Visual Investor
- VectorVest, Inc.
- Executive Premier Workshop
- One-Day Options Course
- OptionsPro
- Retirement Income Workshop
- Sure-Fire Trading Systems (VectorVest, Inc.)
- Trading as a Business Workshop
- VectorVest 7 EOD
- VectorVest 7 RealTime/IntraDay
- VectorVest AutoTester
- VectorVest Educational Services
- VectorVest OnLine
- VectorVest Options Analyzer
- VectorVest ProGraphics v6.0
- VectorVest ProTrader 7
- VectorVest RealTime Derby Tool
- VectorVest Simulator
- VectorVest Variator
- VectorVest Watchdog
