HOT TOPICS LIST
- MACD
- Fibonacci
- RSI
- Gann
- ADXR
- Stochastics
- Volume
- Triangles
- Futures
- Cycles
- Volatility
- ZIGZAG
- MESA
- Retracement
- Aroon
INDICATORS LIST
LIST OF TOPICS
PRINT THIS ARTICLE
by Koos van der Merwe
CMGI is a global internet operating and development company. Companies in the CMGI network span a range of verticle market segments including search and portals, e-business interactive marketing and internet professional services. On April 28, 2000, its share price reached a high of $96.21, and by August 19, 2002, the price was $0.29. With the resurgence of internet companies recently, is this stock worth adding to your portfolio?
Position: Buy
Koos van der Merwe
Has been a technical analyst since 1969, and has worked as a futures and options trader with First Financial Futures in Johannesburg, South Africa.
PRINT THIS ARTICLE
CUP WITH HANDLE
CMGI Consolidated
07/02/03 08:36:29 AMby Koos van der Merwe
CMGI is a global internet operating and development company. Companies in the CMGI network span a range of verticle market segments including search and portals, e-business interactive marketing and internet professional services. On April 28, 2000, its share price reached a high of $96.21, and by August 19, 2002, the price was $0.29. With the resurgence of internet companies recently, is this stock worth adding to your portfolio?
Position: Buy
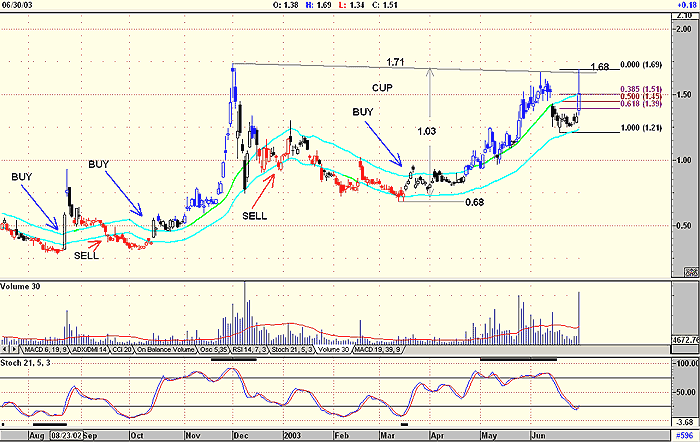
| The first thing you see on CMGI's chart is a developing cup and handle formation, with the handle's resistance level at the $1.68, a level briefly touched on June 30th, on exceptionally strong volume. This rise on rising volume is in itself a bullish sign, especially when on closer examination, the price appears to fall on weak volume, another sign of strength. |
| A second bullish feature is the JM Buy signal given on the 20th of March. In this chart, the JM internal band is a 28-day moving average with a 10% offset positive and negative. Finally, the stochastic, (21,5,3) my preferred indicator for this chart, has also fallen to oversold levels and looks as though it may have given a buy signal by breaking above the 20 level. Given the above signals, the question is, when is the best time to buy the stock if you don't already own it? The obvious and safest choice would be to wait until the price breaks above the $1.68 level, the "handle" of the cup and handle formation. However, with any retracement in the stock after the meteoric rise on the 30th, you can look for support at any one of the Fibonocci retracement levels as shown on the chart, namely $1.51 (38.5%), $1.45 (50%), or $1.39 (61.8%). To err on the side of caution is obviously the best bet, but you can consider a fall on below average volume to any one of the levels mentioned as a gamble having a good probability of paying off. |

|
| Figure 1: CMGI. Is it coming back? |
| Graphic provided by: AdvancedGET. |
| |
| The suggested target as calculated would be $2.74. ($1.71 - $0.68 = $1.03 + $1.71 = $2.74.) Assuming you bought at the 50% retracement level, at $1.45, your profit would therefore be $1.29. Your stop-loss on $1.45 is $0.14, and at a 2.5:1 profit ratio, your profit potential is excellent. Even buying at the $1.68 handle breakout gives you a good risk reward profile. |
| Finally, for those of you watching realtime charts, look at an hourly chart and consider a 12 RSI as the indicator of choice. Wait for the RSI to fall below the 30 level should you wish to buy at a price pre-empting the $1.68 breakout. As at time of writing, the buy target is approximately $1.40, close enough to the $1.39 of the 61.8% retracement level to be seriously considered. |
Has been a technical analyst since 1969, and has worked as a futures and options trader with First Financial Futures in Johannesburg, South Africa.
| Address: | 3256 West 24th Ave |
| Vancouver, BC | |
| Phone # for sales: | 6042634214 |
| E-mail address: | petroosp@gmail.com |
Click here for more information about our publications!
Comments
Date: 07/08/03Rank: 5Comment:

Request Information From Our Sponsors
- VectorVest, Inc.
- Executive Premier Workshop
- One-Day Options Course
- OptionsPro
- Retirement Income Workshop
- Sure-Fire Trading Systems (VectorVest, Inc.)
- Trading as a Business Workshop
- VectorVest 7 EOD
- VectorVest 7 RealTime/IntraDay
- VectorVest AutoTester
- VectorVest Educational Services
- VectorVest OnLine
- VectorVest Options Analyzer
- VectorVest ProGraphics v6.0
- VectorVest ProTrader 7
- VectorVest RealTime Derby Tool
- VectorVest Simulator
- VectorVest Variator
- VectorVest Watchdog
- StockCharts.com, Inc.
- Candle Patterns
- Candlestick Charting Explained
- Intermarket Technical Analysis
- John Murphy on Chart Analysis
- John Murphy's Chart Pattern Recognition
- John Murphy's Market Message
- MurphyExplainsMarketAnalysis-Intermarket Analysis
- MurphyExplainsMarketAnalysis-Visual Analysis
- StockCharts.com
- Technical Analysis of the Financial Markets
- The Visual Investor
