

HOT TOPICS LIST
- MACD
- Fibonacci
- RSI
- Gann
- ADXR
- Stochastics
- Volume
- Triangles
- Futures
- Cycles
- Volatility
- ZIGZAG
- MESA
- Retracement
- Aroon
INDICATORS LIST
LIST OF TOPICS
PRINT THIS ARTICLE
by Arthur Hill
Lexmark (LXK) has been a stellar performer over the last few months, but a series of bearish divergences in a number of indicators suggests that a top is near.
Position: Sell
Arthur Hill
Arthur Hill is currently editor of TDTrader.com, a website specializing in trading strategies, sector/industry specific breadth stats and overall technical analysis. He passed the Society of Technical Analysts (STA London) diploma exam with distinction is a Certified Financial Technician (CFTe). Prior to TD Trader, he was the Chief Technical Analyst for Stockcharts.com and the main contributor to the ChartSchool.
PRINT THIS ARTICLE
CHART ANALYSIS
Lexmark Starts Losing the Plot
07/01/03 10:47:18 AMby Arthur Hill
Lexmark (LXK) has been a stellar performer over the last few months, but a series of bearish divergences in a number of indicators suggests that a top is near.
Position: Sell
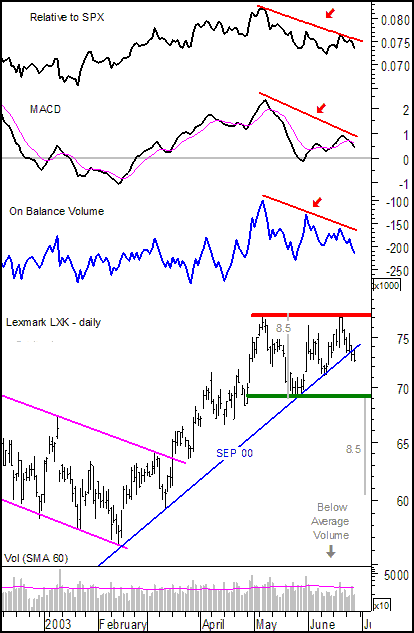
| One bearish divergence in one indicator would not be cause for concern, but a bearish divergence in three different indicators is cause for concern. Mulicolinearity refers to the practice of avoiding indicators that provide essentially the same information or are highly correlated. RSI, MACD, stochastics and rate-of-change are all momentum indicators that are highly correlated. When one advances, the others are never far behind. Using non-correlated indicators avoids this problem, helps confirm divergences, and reinforces the signals. |
|
| Figure 1: Daily chart for Lexmark (LXK) |
| Graphic provided by: MetaStock. |
| |
| For LXK, three indicators have been chosen: MACD for momentum; on balance volume (OBV) for money flows; and the "price relative" to gauge relative strength. LXK moved above 77 twice in the last two months, but all three indicators peaked in May and formed lower highs in June. The red lines and red arrows mark these bearish divergences. The inability of these indicators to return to their prior highs, as did the stock, reflects less strength in the second advance than in the first advance. Less strength is often the first sign of trouble. |
| The advance in LXK back to resistance around 77 was not confirmed by any of these indicators and this reinforces the potential for a double top. Technically, a double top would not be confirmed unless the stock declines below 69 and breaks key support. A move below this level would project a decline to around 60 (77.5 - 69 = 8.5, 69 - 8.5 = 60.5). Also notice that upside volume was low in June and the stock had already broken below the trendline extending up from Sep-00. |
Arthur Hill is currently editor of TDTrader.com, a website specializing in trading strategies, sector/industry specific breadth stats and overall technical analysis. He passed the Society of Technical Analysts (STA London) diploma exam with distinction is a Certified Financial Technician (CFTe). Prior to TD Trader, he was the Chief Technical Analyst for Stockcharts.com and the main contributor to the ChartSchool.
| Title: | Editor |
| Company: | TDTrader.com |
| Address: | Willem Geetsstraat 17 |
| Mechelen, B2800 | |
| Phone # for sales: | 3215345465 |
| Website: | www.tdtrader.com |
| E-mail address: | arthurh@tdtrader.com |
Traders' Resource Links | |
| TDTrader.com has not added any product or service information to TRADERS' RESOURCE. | |
Click here for more information about our publications!
PRINT THIS ARTICLE

Request Information From Our Sponsors
- StockCharts.com, Inc.
- Candle Patterns
- Candlestick Charting Explained
- Intermarket Technical Analysis
- John Murphy on Chart Analysis
- John Murphy's Chart Pattern Recognition
- John Murphy's Market Message
- MurphyExplainsMarketAnalysis-Intermarket Analysis
- MurphyExplainsMarketAnalysis-Visual Analysis
- StockCharts.com
- Technical Analysis of the Financial Markets
- The Visual Investor
- VectorVest, Inc.
- Executive Premier Workshop
- One-Day Options Course
- OptionsPro
- Retirement Income Workshop
- Sure-Fire Trading Systems (VectorVest, Inc.)
- Trading as a Business Workshop
- VectorVest 7 EOD
- VectorVest 7 RealTime/IntraDay
- VectorVest AutoTester
- VectorVest Educational Services
- VectorVest OnLine
- VectorVest Options Analyzer
- VectorVest ProGraphics v6.0
- VectorVest ProTrader 7
- VectorVest RealTime Derby Tool
- VectorVest Simulator
- VectorVest Variator
- VectorVest Watchdog