HOT TOPICS LIST
- MACD
- Fibonacci
- RSI
- Gann
- ADXR
- Stochastics
- Volume
- Triangles
- Futures
- Cycles
- Volatility
- ZIGZAG
- MESA
- Retracement
- Aroon
INDICATORS LIST
LIST OF TOPICS
PRINT THIS ARTICLE
by Arthur Hill
The long-term trend for the iShares 7-10 Year Treasury Bond Fund (IEF) remains up, but a key outside reversal week suggests further downside before a resumption higher is possible.
Position: Hold
Arthur Hill
Arthur Hill is currently editor of TDTrader.com, a website specializing in trading strategies, sector/industry specific breadth stats and overall technical analysis. He passed the Society of Technical Analysts (STA London) diploma exam with distinction is a Certified Financial Technician (CFTe). Prior to TD Trader, he was the Chief Technical Analyst for Stockcharts.com and the main contributor to the ChartSchool.
PRINT THIS ARTICLE
REVERSAL
Key Outside Reversal Rattles Bonds
07/01/03 10:53:47 AMby Arthur Hill
The long-term trend for the iShares 7-10 Year Treasury Bond Fund (IEF) remains up, but a key outside reversal week suggests further downside before a resumption higher is possible.
Position: Hold
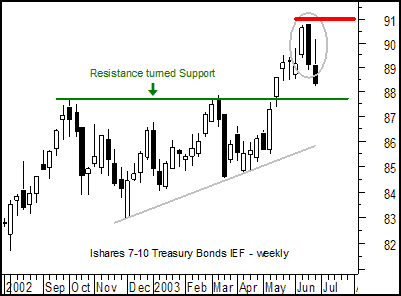
| On the weekly chart, the gray oval shows the key outside reversal week. This pattern forms with an open above the prior week's high and a close below the prior week's low. The bulls started the week strong, but the bears soon wrestled control and forced prices below the low of the prior week. Weekly key outside reversals can be powerful patterns to signal a peak in the market. At the very least, this key outside reversal establishes an important resistance level at 90.80. |

|
| Figure 1: Weekly chart for the iShares 7-10 Year Treasury Bond Fund (IEF). |
| Graphic provided by: MetaStock. |
| |
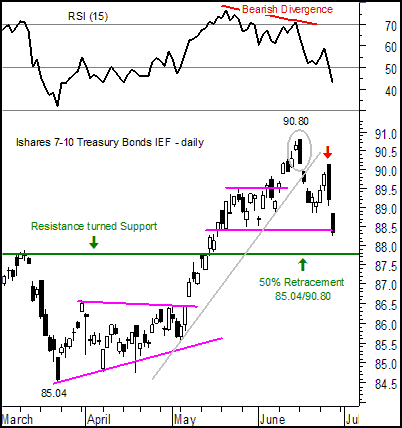
| The daily chart confirms medium-term weakness. A key outside reversal day formed at 90.80 (gray oval) and IEF broke trendline support with a sharp decline to 88.85. After a brief rally, another key outside reversal day formed (red arrow) and this too was followed by further weakness. In addition, 15-day RSI formed a bearish divergence and moved below 50. Medium-term momentum has swung in favor of the bears. |
 Figure 2: Daily chart for the iShares 7-10 Year Treasury Bond Fund (IEF). |
| The long-term trend remains bullish though as IEF broke above a major resistance level at 87.8 in early June. Broken resistance often turns into support and a return to scene of the crime (breakout) is quite common. In addition, a 50% retracement of the prior advance confirms potential support around 87.8 and a possible end to the current correction on the daily charts. |
Arthur Hill is currently editor of TDTrader.com, a website specializing in trading strategies, sector/industry specific breadth stats and overall technical analysis. He passed the Society of Technical Analysts (STA London) diploma exam with distinction is a Certified Financial Technician (CFTe). Prior to TD Trader, he was the Chief Technical Analyst for Stockcharts.com and the main contributor to the ChartSchool.
| Title: | Editor |
| Company: | TDTrader.com |
| Address: | Willem Geetsstraat 17 |
| Mechelen, B2800 | |
| Phone # for sales: | 3215345465 |
| Website: | www.tdtrader.com |
| E-mail address: | arthurh@tdtrader.com |
Traders' Resource Links | |
| TDTrader.com has not added any product or service information to TRADERS' RESOURCE. | |
Click here for more information about our publications!
PRINT THIS ARTICLE

Request Information From Our Sponsors
- StockCharts.com, Inc.
- Candle Patterns
- Candlestick Charting Explained
- Intermarket Technical Analysis
- John Murphy on Chart Analysis
- John Murphy's Chart Pattern Recognition
- John Murphy's Market Message
- MurphyExplainsMarketAnalysis-Intermarket Analysis
- MurphyExplainsMarketAnalysis-Visual Analysis
- StockCharts.com
- Technical Analysis of the Financial Markets
- The Visual Investor
- VectorVest, Inc.
- Executive Premier Workshop
- One-Day Options Course
- OptionsPro
- Retirement Income Workshop
- Sure-Fire Trading Systems (VectorVest, Inc.)
- Trading as a Business Workshop
- VectorVest 7 EOD
- VectorVest 7 RealTime/IntraDay
- VectorVest AutoTester
- VectorVest Educational Services
- VectorVest OnLine
- VectorVest Options Analyzer
- VectorVest ProGraphics v6.0
- VectorVest ProTrader 7
- VectorVest RealTime Derby Tool
- VectorVest Simulator
- VectorVest Variator
- VectorVest Watchdog
