HOT TOPICS LIST
- MACD
- Fibonacci
- RSI
- Gann
- ADXR
- Stochastics
- Volume
- Triangles
- Futures
- Cycles
- Volatility
- ZIGZAG
- MESA
- Retracement
- Aroon
INDICATORS LIST
LIST OF TOPICS
PRINT THIS ARTICLE
by Kevin Hopson
ExxonMobil Corp. recently broke out of a long-term triangle formation. Now that the stock has proceeded to pull back and key support is coming into play, a good buying opportunity has presented itself.
Position: Accumulate
Kevin Hopson
Kevin has been a technical analyst for roughly 10 years now. Previously, Kevin owned his own business and acted as a registered investment advisor, specializing in energy. He was also a freelance oil analyst for Orient Trading Co., a commodity futures trading firm in Japan. Kevin is currently a freelance writer.
PRINT THIS ARTICLE
TECHNICAL ANALYSIS
ExxonMobil Corp. Approaching Key Support
07/01/03 10:43:40 AMby Kevin Hopson
ExxonMobil Corp. recently broke out of a long-term triangle formation. Now that the stock has proceeded to pull back and key support is coming into play, a good buying opportunity has presented itself.
Position: Accumulate
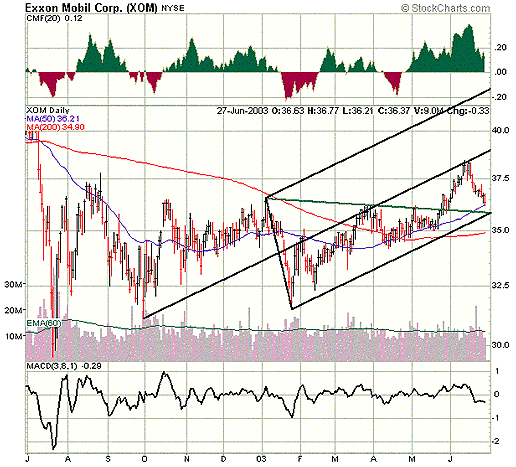
| ExxonMobil Corp. (XOM) is the largest integrated oil company in the world with a primary focus on oil and gas exploration and production, as well as the refining of petroleum products. Much like the AMEX Oil Index (XOI), ExxonMobil recently broke to the upside from a long-term triangle formation, which indicated the potential completion of a two-year downtrend. Since ExxonMobil - and the integrated oil group in general - appear to be in the first leg of a long-term uptrend, significant pullbacks should be considered excellent buying opportunities. |
| ExxonMobil has now pulled back to its 50-day moving average ($36.21), a level that has provided ultimate support the last few months. In fact, the stock bounced off this level on Friday. Also, if you look at the chart, you will notice two other support levels converging just below the stock's 50-day moving average. The first is January's downtrend line, which ExxonMobil broke above in late-May. Since this trendline acted as resistance for nearly five months, the stock should now find support along this line. |

|
| Figure 1: Daily chart for XOM. |
| Graphic provided by: Stockcharts.com. |
| |
| Additionally, you will notice January's uptrend line, which is represented by the bottom parallel line of the black pitchfork. Notice how the stock has traded within the bottom channel of the pitchfork since January. This is the sign of a strong uptrend, meaning that ExxonMobil should reverse upon a test of the bottom parallel line. With the 50-day moving average already coming into play and trendline support converging just below the $36.00 level, the near-term downside potential appears to be minimal. As a result, I would look to accumulate shares of ExxonMobil on any short-term price weakness. |
Kevin has been a technical analyst for roughly 10 years now. Previously, Kevin owned his own business and acted as a registered investment advisor, specializing in energy. He was also a freelance oil analyst for Orient Trading Co., a commodity futures trading firm in Japan. Kevin is currently a freelance writer.
| Glen Allen, VA | |
| E-mail address: | hopson_1@yahoo.com |
Click here for more information about our publications!
PRINT THIS ARTICLE

Request Information From Our Sponsors
- VectorVest, Inc.
- Executive Premier Workshop
- One-Day Options Course
- OptionsPro
- Retirement Income Workshop
- Sure-Fire Trading Systems (VectorVest, Inc.)
- Trading as a Business Workshop
- VectorVest 7 EOD
- VectorVest 7 RealTime/IntraDay
- VectorVest AutoTester
- VectorVest Educational Services
- VectorVest OnLine
- VectorVest Options Analyzer
- VectorVest ProGraphics v6.0
- VectorVest ProTrader 7
- VectorVest RealTime Derby Tool
- VectorVest Simulator
- VectorVest Variator
- VectorVest Watchdog
- StockCharts.com, Inc.
- Candle Patterns
- Candlestick Charting Explained
- Intermarket Technical Analysis
- John Murphy on Chart Analysis
- John Murphy's Chart Pattern Recognition
- John Murphy's Market Message
- MurphyExplainsMarketAnalysis-Intermarket Analysis
- MurphyExplainsMarketAnalysis-Visual Analysis
- StockCharts.com
- Technical Analysis of the Financial Markets
- The Visual Investor
