HOT TOPICS LIST
- MACD
- Fibonacci
- RSI
- Gann
- ADXR
- Stochastics
- Volume
- Triangles
- Futures
- Cycles
- Volatility
- ZIGZAG
- MESA
- Retracement
- Aroon
INDICATORS LIST
LIST OF TOPICS
PRINT THIS ARTICLE
by Kevin Hopson
Denbury Resources broke out of a long-term bullish triangle in May but now that the stock has proceeded higher, there are conflicting signs as to which way prices will move in the near-term.
Position: Hold
Kevin Hopson
Kevin has been a technical analyst for roughly 10 years now. Previously, Kevin owned his own business and acted as a registered investment advisor, specializing in energy. He was also a freelance oil analyst for Orient Trading Co., a commodity futures trading firm in Japan. Kevin is currently a freelance writer.
PRINT THIS ARTICLE
TECHNICAL ANALYSIS
Mixed Signals for Denbury Resources
07/01/03 02:17:26 PMby Kevin Hopson
Denbury Resources broke out of a long-term bullish triangle in May but now that the stock has proceeded higher, there are conflicting signs as to which way prices will move in the near-term.
Position: Hold
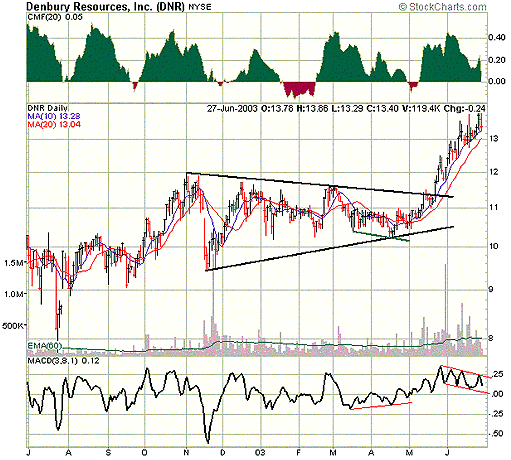
| Denbury Resources (DNR) is an oil and gas exploration and production company with a primary focus in the Gulf Coast region of the United States. In May, the stock broke out of a six-and-a-half-month bullish triangle formation, which is indicated by the black trendlines in the one-year chart. This move was anticipated for a couple of reasons. For example, the symmetrical triangle tends to be a continuation pattern. Since Denbury was in an uptrend prior to the formation of this triangle, it was a sign that higher prices would likely prevail. |
| Additionally, the stock saw a bullish divergence in the moving average convergence/divergence (MACD) indicator from mid-March to mid-April. In other words, while Denbury was putting in lower lows (as indicated by the green line in the chart), the MACD was putting in higher lows. This was a sign that the stock would likely reverse. As you can see, this occurred and Denbury eventually broke to the upside from its long-term bullish triangle formation. |

|
| Figure 1: Daily chart for DNR. |
| Graphic provided by: Stockcharts.com. |
| |
| However, the stock is now giving mixed signals, making it difficult to predict which way Denbury will move in the near-term. For example, the triangle breakout indicated a potential price target of $13.90/share. This was calculated by taking the base of the triangle ($12.00-$9.50) and adding it to the breakout point ($11.40 + $2.50 = $13.90). As you can see, Denbury hit a new 52-week high ($13.86) on Friday, which effectively met the $13.90 price target. So where do we go from here? |
| Well, this is where it gets tricky. If you look at the chart, you will notice that the stock is forming an ascending triangle, a pattern of higher lows and horizontal highs. More specifically, the $13.80 level has acted as resistance several times this month, while the stock's rising 10-day moving average ($13.28) continues to act as support. Since ascending triangles tend to break to the upside, one could anticipate further price appreciation. |
| Unfortunately, we are now seeing a bearish divergence in the MACD. In other words, the MACD has been putting in lower highs while the stock price has continued to hit new 52-week highs. Since Denbury has reached its projected price target and there has been no follow-through in the MACD to confirm higher prices, the stock could be setting up for a reversal. As a result, it will be important to watch some key price levels to determine which way Denbury breaks in the near-term. More specifically, if Denbury can break resistance just below the $14.00 level and do so on heavy volume, the stock should see a further move up to the $15.00 level. On the other hand, if Denbury breaches its 10- and 20-day moving averages, which have acted as support since early May, the stock could be headed back to the $12.00 level, site of its 50-day moving average. |
Kevin has been a technical analyst for roughly 10 years now. Previously, Kevin owned his own business and acted as a registered investment advisor, specializing in energy. He was also a freelance oil analyst for Orient Trading Co., a commodity futures trading firm in Japan. Kevin is currently a freelance writer.
| Glen Allen, VA | |
| E-mail address: | hopson_1@yahoo.com |
Click here for more information about our publications!
PRINT THIS ARTICLE

Request Information From Our Sponsors
- StockCharts.com, Inc.
- Candle Patterns
- Candlestick Charting Explained
- Intermarket Technical Analysis
- John Murphy on Chart Analysis
- John Murphy's Chart Pattern Recognition
- John Murphy's Market Message
- MurphyExplainsMarketAnalysis-Intermarket Analysis
- MurphyExplainsMarketAnalysis-Visual Analysis
- StockCharts.com
- Technical Analysis of the Financial Markets
- The Visual Investor
- VectorVest, Inc.
- Executive Premier Workshop
- One-Day Options Course
- OptionsPro
- Retirement Income Workshop
- Sure-Fire Trading Systems (VectorVest, Inc.)
- Trading as a Business Workshop
- VectorVest 7 EOD
- VectorVest 7 RealTime/IntraDay
- VectorVest AutoTester
- VectorVest Educational Services
- VectorVest OnLine
- VectorVest Options Analyzer
- VectorVest ProGraphics v6.0
- VectorVest ProTrader 7
- VectorVest RealTime Derby Tool
- VectorVest Simulator
- VectorVest Variator
- VectorVest Watchdog
