HOT TOPICS LIST
- MACD
- Fibonacci
- RSI
- Gann
- ADXR
- Stochastics
- Volume
- Triangles
- Futures
- Cycles
- Volatility
- ZIGZAG
- MESA
- Retracement
- Aroon
INDICATORS LIST
LIST OF TOPICS
PRINT THIS ARTICLE
by Koos van der Merwe
On April 18, 2003 I submitted an article on Coolbrands (Is Coolbrands Cooling Down) I concluded 'I would suggest buying on any pullback...' Was I correct in my analysis?
Position: Hold
Koos van der Merwe
Has been a technical analyst since 1969, and has worked as a futures and options trader with First Financial Futures in Johannesburg, South Africa.
PRINT THIS ARTICLE
MOVING AVERAGES
Coolbrands Revisited.
06/27/03 12:57:55 PMby Koos van der Merwe
On April 18, 2003 I submitted an article on Coolbrands (Is Coolbrands Cooling Down) I concluded 'I would suggest buying on any pullback...' Was I correct in my analysis?
Position: Hold
| As you can see from the chart, yes I was, and those investors that bought at C$8.24 are doing very nicely. But what now? The FTC's decision has not yet been finalized, although by the time this article appears, it will be, which means that the share has moved up purely on speculation that the decision will be in favor of the sale by Nestle of a number of brands to Cool brands. The maxim, buy on rumor and sell on fact now comes to mind. Should you sell on the day the announcement is made public? What are the charts telling you? |
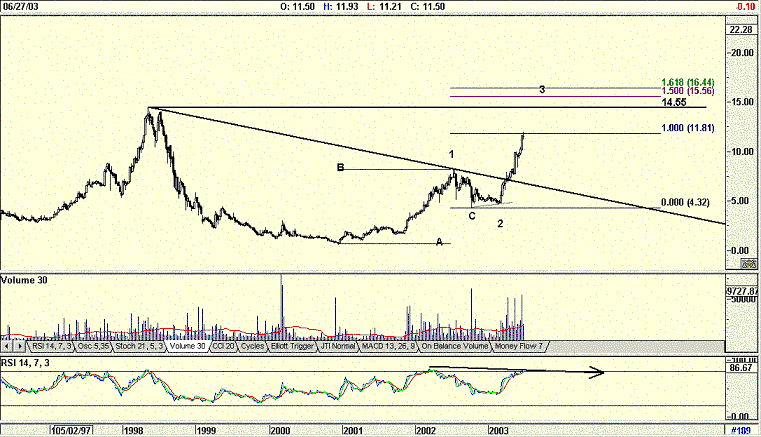
| The weekly chart below is a duplicate of the chart of the April 18, 2003 showing how the share price has risen since the break out upwards from the cup and handle formation that had formed. I have added a Fibonacci extension of the initial rise A, B, from C. This suggests that at present level of C$11.81, the price has equaled the rise from A to B, which should act as a resistance level. Furthermore, there is a strong resistance at the double top high of $14.55. If, however, the recovery follows an Elliott wave pattern, then the chart has completed waves 1 and 2 and with wave 3 should reach a high of 16.44 (1.618% of wave 1) before a correction in wave 4. |

|
| Figure 1: Weekly chart for Coolbrands. |
| Graphic provided by: AdvancedGET. |
| |
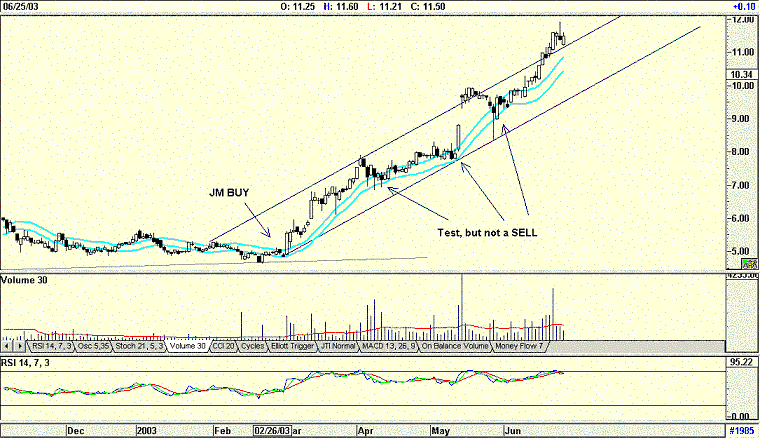
| So, the question: Is Coolbrands still a buy, even at present levels, and if I already own the share, should I take profits? Daily charts are showing that any down move is on falling volume, a sign of strength. The chart also shows that the share broke above the short-term resistance line, and could be turning it into a support line. The chart also shows that on the March 3, 2003, it gave a JM buy signal, and although it tested the lower JM band, three times it has not broken it, to give a sell signal. To recap, a JM internal band is a 15-period moving average offset by 2% positive and 2% negative. |
 Figure 2: Daily chart for Coolbrands. Finally, on the fundamental side, do not forget that Coolbrands will be doubling its asset base should the deal go through, and at a very favorable price. The share could fall because of profit taking, but that is short-term. For the long term, things still looks good. If you are holding, then just to be safe, shorten your stops, possible to just below (I like using 2% as my error) the resistance or now possibly support line, and let your profits ride. |
Has been a technical analyst since 1969, and has worked as a futures and options trader with First Financial Futures in Johannesburg, South Africa.
| Address: | 3256 West 24th Ave |
| Vancouver, BC | |
| Phone # for sales: | 6042634214 |
| E-mail address: | petroosp@gmail.com |
Click here for more information about our publications!
PRINT THIS ARTICLE

|

Request Information From Our Sponsors
- StockCharts.com, Inc.
- Candle Patterns
- Candlestick Charting Explained
- Intermarket Technical Analysis
- John Murphy on Chart Analysis
- John Murphy's Chart Pattern Recognition
- John Murphy's Market Message
- MurphyExplainsMarketAnalysis-Intermarket Analysis
- MurphyExplainsMarketAnalysis-Visual Analysis
- StockCharts.com
- Technical Analysis of the Financial Markets
- The Visual Investor
- VectorVest, Inc.
- Executive Premier Workshop
- One-Day Options Course
- OptionsPro
- Retirement Income Workshop
- Sure-Fire Trading Systems (VectorVest, Inc.)
- Trading as a Business Workshop
- VectorVest 7 EOD
- VectorVest 7 RealTime/IntraDay
- VectorVest AutoTester
- VectorVest Educational Services
- VectorVest OnLine
- VectorVest Options Analyzer
- VectorVest ProGraphics v6.0
- VectorVest ProTrader 7
- VectorVest RealTime Derby Tool
- VectorVest Simulator
- VectorVest Variator
- VectorVest Watchdog
