HOT TOPICS LIST
- MACD
- Fibonacci
- RSI
- Gann
- ADXR
- Stochastics
- Volume
- Triangles
- Futures
- Cycles
- Volatility
- ZIGZAG
- MESA
- Retracement
- Aroon
INDICATORS LIST
LIST OF TOPICS
PRINT THIS ARTICLE
by Gary Grosschadl
Siebel's recent bearish action has bullish overtones when taking a chart pattern into consideration.
Position: Buy
Gary Grosschadl
Independent Canadian equities trader and technical analyst based in Peterborough
Ontario, Canada.
PRINT THIS ARTICLE
ASCENDING TRIANGLES
Throwback For Siebel Systems
06/30/03 08:44:15 AMby Gary Grosschadl
Siebel's recent bearish action has bullish overtones when taking a chart pattern into consideration.
Position: Buy
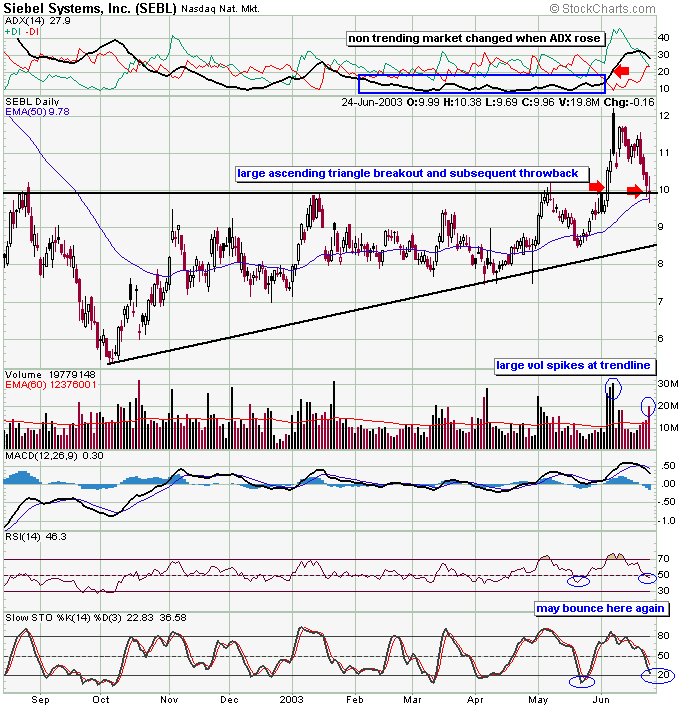
| An ascending triangle is a potentially bullish formation usually found as a continuation pattern in an existing uptrend. However this somtimes also can mark a bottom reversal. This is the case for SEBL as the 10 month daily chart shows. |
| As is the nature of an ascending triangle, multiple attempts are made to break past the top trendline until success is finally achieved. In this case the fourth attempt was successful and large volume accompanied the breakout giving validity to the pattern. A rapid three day ascent followed until profit takers decided that the move had got ahead of itself. |

|
| Daily chart for Siebel Systems. |
| Graphic provided by: stockcharts.com. |
| |
| When patterns like this break, they can come back to the original breakout point to test support before once again resuming the upleg. The principal of "what was resistance is now support" is a hallmark of stocks in an uptrend. When this happens in a more dramatic fashion it can be referred to as a "throwback". These throwbacks have three calling cards if you will. They have a very noticeable white space as the formation curls back to the original pattern, price must touch/pierce or at least come very close to the original breakout point, and ideally the interval of time from breakout to throwback should be within 30 days. The June 2002 issue of Technical Analysis of Stocks & Commodities has an excellent article explaining throwbacks and pullbacks written by Thomas Bulkowski. |
| The lower indicators on the chart show the RSI (relative strength index) and stochastics in a similar position to the previous retracement bounce. Adding credence to this idea is the 50-day EMA (exponential moving average). This moving average line acted as a launchpad to resume the previous upleg and may well repeat here especially since it is no near this important trendline. |
| The directional movement indicator (DMI) at the top of the chart is worth noting. This superior trend strength indictor shows well the transformation of previous relative trendless action which can be typical when stocks are in an ascending triangle. The breakout was accompanied by the black ADX moving above -DI with a good upslope. This indicated increasing trend strength, something previous attempts at the top trendline failed to have. Watch for possible bounce prospects here making Sieble Systems a buy. To be safe, I would not tolerate a close below $9.60 as this throws the bullish intent into serious question. |
Independent Canadian equities trader and technical analyst based in Peterborough
Ontario, Canada.
| Website: | www.whatsonsale.ca/financial.html |
| E-mail address: | gwg7@sympatico.ca |
Click here for more information about our publications!
Comments
Date: 07/01/03Rank: 5Comment:

Request Information From Our Sponsors
- StockCharts.com, Inc.
- Candle Patterns
- Candlestick Charting Explained
- Intermarket Technical Analysis
- John Murphy on Chart Analysis
- John Murphy's Chart Pattern Recognition
- John Murphy's Market Message
- MurphyExplainsMarketAnalysis-Intermarket Analysis
- MurphyExplainsMarketAnalysis-Visual Analysis
- StockCharts.com
- Technical Analysis of the Financial Markets
- The Visual Investor
- VectorVest, Inc.
- Executive Premier Workshop
- One-Day Options Course
- OptionsPro
- Retirement Income Workshop
- Sure-Fire Trading Systems (VectorVest, Inc.)
- Trading as a Business Workshop
- VectorVest 7 EOD
- VectorVest 7 RealTime/IntraDay
- VectorVest AutoTester
- VectorVest Educational Services
- VectorVest OnLine
- VectorVest Options Analyzer
- VectorVest ProGraphics v6.0
- VectorVest ProTrader 7
- VectorVest RealTime Derby Tool
- VectorVest Simulator
- VectorVest Variator
- VectorVest Watchdog
