HOT TOPICS LIST
- MACD
- Fibonacci
- RSI
- Gann
- ADXR
- Stochastics
- Volume
- Triangles
- Futures
- Cycles
- Volatility
- ZIGZAG
- MESA
- Retracement
- Aroon
INDICATORS LIST
LIST OF TOPICS
PRINT THIS ARTICLE
by Koos van der Merwe
When I first started trading the stock market back when, I looked around for a way to interpret charts as an addition to the fundamental analysis I then used. I discovered point and figure charting as interpreted by Cohen. In those early days before computers, I religiously plotted daily charts every morning and weekly charts every Sunday evening, by hand. (I still have the charts.) Today, although I do most of my analysis with candlestick charts on a computer, I find, that when I am undecided on the interpretation of a chart, I still instinctively turn to point and figure for a clue.
Position: Accumulate
Koos van der Merwe
Has been a technical analyst since 1969, and has worked as a futures and options trader with First Financial Futures in Johannesburg, South Africa.
PRINT THIS ARTICLE
POINT & FIGURE
Bombardier And Point And Figure
06/26/03 03:45:37 PMby Koos van der Merwe
When I first started trading the stock market back when, I looked around for a way to interpret charts as an addition to the fundamental analysis I then used. I discovered point and figure charting as interpreted by Cohen. In those early days before computers, I religiously plotted daily charts every morning and weekly charts every Sunday evening, by hand. (I still have the charts.) Today, although I do most of my analysis with candlestick charts on a computer, I find, that when I am undecided on the interpretation of a chart, I still instinctively turn to point and figure for a clue.
Position: Accumulate
| The Canadian based company Bombardier's core businesses are aerospace, transportation, and recreational projects. Since 9/11, the company experienced a slowdown in the sales of aircraft, and as a result has slowly been divesting itself of various assets to concentrate on its core business, which is aerospace and transportation. At a recent speech on June 10, 2003, its new CEO, Paul Tellier stated, "We aren't trying to hide anything; our company is suffering from a temporary crises of confidence." |
| Since September 11th 2000, the share price has fallen from $26.18 Canadian, to its low of $2.56 Canadian on March, 28 2003. From that low, the share has risen to $4.70 and oscillators are suggesting that the price could be at overbought levels. "We have to be patient. The coming months will continue to be uncertain because of the persistent weakness of the U.S. and European economies." (Paul Tellier, June 10th 2003.) |

|
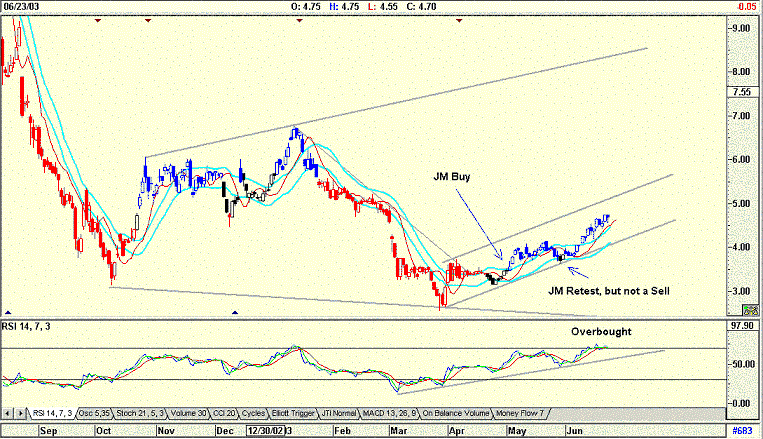
| Figure 1: Candlestick chart of Bombardier |
| Graphic provided by: AdvancedGET. |
| |
| What Mr. Tellier is telling us is that as the U.S. and European markets start recovering, so will Bombardier. A candlestick daily chart is showing an overbought RSI and stochastic, suggesting weakness, for the short-term. However, with the U.S. economy starting to show strength, it is possible the chart is not giving an easy read. For the medium term there is a trumpet formation, which is a sign of uncertainty that makes a read and forecast even more difficult. |
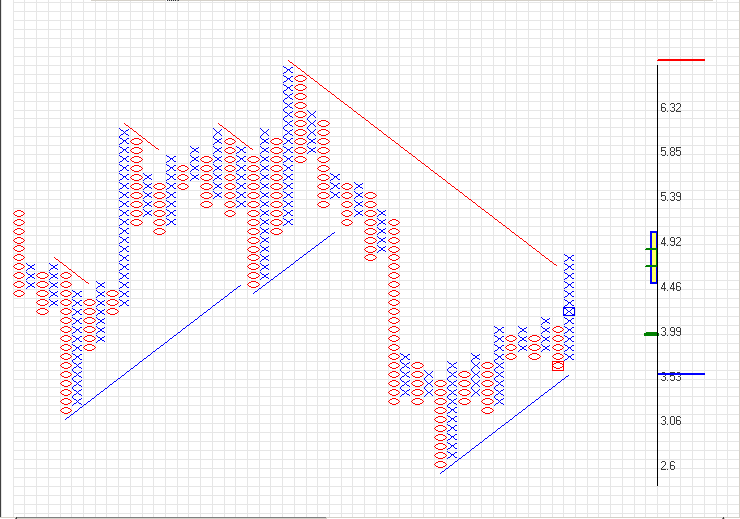
On May 1, 2003 the chart broke above the upper JM Band line (15-period moving average offset by 2% positive and 2% negative). The lower JM band was tested on the May 29, 2003 but held. Since then the share price has started rising, and were it not for the overbought RSI, I would be very positive. With this doubt in my mind, I now look at a point and figure chart. Figure 2: Point and figure chart for Bombardier. Graphic provided by: PFScan |
| A point and figure chart measures supply and demand only. There is no time included in the chart. The chart below, is a 3 point reversal, with each block 0.093 automatically calculated by the program I use. It shows how the share fell from a high of C$6.696 on December 30, 2002 to the low of C$2.60 on March 24, 2003. From that date the price has risen, giving two very positive buy signals as it broke above the triple top formations that had formed. The chart also shows that the price broke above its main resistance line drawn from the high of C$6.696 at a 45 degree angle, downwards. Determining a horizontal breakout target from the triple top breakout at C$4.18 suggests a target of C$5.579. A horizontal break out is determined by counting the number of columns that consolidated before the breakout, in this case six columns. Multiply this by the value of each box and again by the three point reversal. (6 x 3 x 0.093 = C$1.953.) Add this to the breakout level, C$4.18 and you get C$5.854. With the indicators suggesting weakness, I would wait for a pullback to possibly the C$3.67 or C$4.18 level before buying. The former is a 50% retracement level, and the latter is the breakout level on the P&F chart. I will look to indicators for oversold levels before confirming my buys. To conclude, the line chart is suggesting uncertainty in the medium term and possible strength in the short term after a retracement. This is confirmed by the P&F chart. The target determined by a horizontal count once a buy signal is underway, is C$5.84. |
Has been a technical analyst since 1969, and has worked as a futures and options trader with First Financial Futures in Johannesburg, South Africa.
| Address: | 3256 West 24th Ave |
| Vancouver, BC | |
| Phone # for sales: | 6042634214 |
| E-mail address: | petroosp@gmail.com |
Click here for more information about our publications!
Comments
Date: 04/29/08Rank: 5Comment:

Request Information From Our Sponsors
- StockCharts.com, Inc.
- Candle Patterns
- Candlestick Charting Explained
- Intermarket Technical Analysis
- John Murphy on Chart Analysis
- John Murphy's Chart Pattern Recognition
- John Murphy's Market Message
- MurphyExplainsMarketAnalysis-Intermarket Analysis
- MurphyExplainsMarketAnalysis-Visual Analysis
- StockCharts.com
- Technical Analysis of the Financial Markets
- The Visual Investor
- VectorVest, Inc.
- Executive Premier Workshop
- One-Day Options Course
- OptionsPro
- Retirement Income Workshop
- Sure-Fire Trading Systems (VectorVest, Inc.)
- Trading as a Business Workshop
- VectorVest 7 EOD
- VectorVest 7 RealTime/IntraDay
- VectorVest AutoTester
- VectorVest Educational Services
- VectorVest OnLine
- VectorVest Options Analyzer
- VectorVest ProGraphics v6.0
- VectorVest ProTrader 7
- VectorVest RealTime Derby Tool
- VectorVest Simulator
- VectorVest Variator
- VectorVest Watchdog
