HOT TOPICS LIST
- MACD
- Fibonacci
- RSI
- Gann
- ADXR
- Stochastics
- Volume
- Triangles
- Futures
- Cycles
- Volatility
- ZIGZAG
- MESA
- Retracement
- Aroon
INDICATORS LIST
LIST OF TOPICS
PRINT THIS ARTICLE
by Gary Grosschadl
A powerful topping pattern hits this high tech stock.
Position: Sell
Gary Grosschadl
Independent Canadian equities trader and technical analyst based in Peterborough
Ontario, Canada.
PRINT THIS ARTICLE
CHART ANALYSIS
Island Reversal For Sun Microsystems (SUNW)
06/26/03 09:49:49 AMby Gary Grosschadl
A powerful topping pattern hits this high tech stock.
Position: Sell
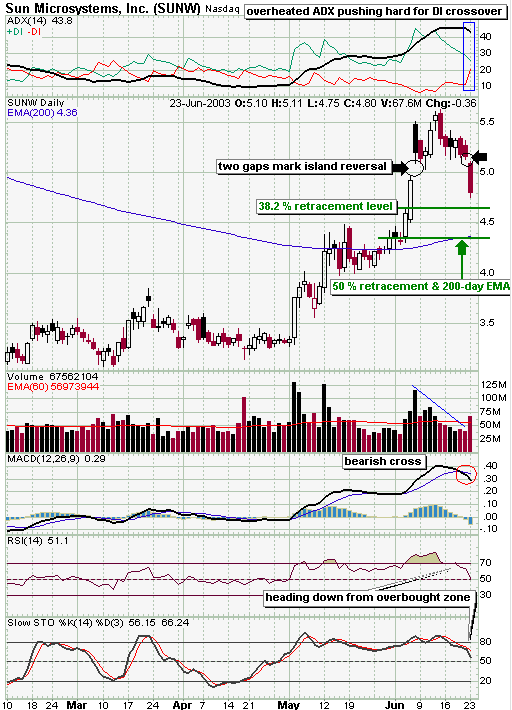
| An island reversal pattern occurs as a topping formation when two gaps mark either side of a series of closes. These gaps appear to leave a set of higher data points "stranded" thereby leaving an "island" behind. That this occured with high volume shows conviction by sellers. |
| Alert traders should have spotted trouble a week earlier when another candlestick topping pattern was put in via a bearish engulfing pattern at the previous top. Again volume gave a valuable clue as the top was on lower volume showing less conviction by the bulls. |

|
| Daily chart for SUNW. |
| Graphic provided by: stockcharts.com. |
| |
| The directional movement indicator (at the top of chart)shows a trend change is likely occuring as the ADX line is reversing off a peak while the DI lines are nearing a bearish crossover. An actual crossover confirms this bearish intent. The other displayed indicators are also showing bearishness via another bearish crossover (MACD) and movement down from overbought levels for RSI and stochastics. |
| Two common Fibonacci retracement levels are shown on the chart as possible support areas. These are derived from the high and low of the chart. The lower one being more meaningful as it also coincides with the 200-day exponential moving average. Failure there would then bring the $4 support level into play. |
Independent Canadian equities trader and technical analyst based in Peterborough
Ontario, Canada.
| Website: | www.whatsonsale.ca/financial.html |
| E-mail address: | gwg7@sympatico.ca |
Click here for more information about our publications!
Comments
Date: 06/27/03Rank: 4Comment:

Request Information From Our Sponsors
- StockCharts.com, Inc.
- Candle Patterns
- Candlestick Charting Explained
- Intermarket Technical Analysis
- John Murphy on Chart Analysis
- John Murphy's Chart Pattern Recognition
- John Murphy's Market Message
- MurphyExplainsMarketAnalysis-Intermarket Analysis
- MurphyExplainsMarketAnalysis-Visual Analysis
- StockCharts.com
- Technical Analysis of the Financial Markets
- The Visual Investor
- VectorVest, Inc.
- Executive Premier Workshop
- One-Day Options Course
- OptionsPro
- Retirement Income Workshop
- Sure-Fire Trading Systems (VectorVest, Inc.)
- Trading as a Business Workshop
- VectorVest 7 EOD
- VectorVest 7 RealTime/IntraDay
- VectorVest AutoTester
- VectorVest Educational Services
- VectorVest OnLine
- VectorVest Options Analyzer
- VectorVest ProGraphics v6.0
- VectorVest ProTrader 7
- VectorVest RealTime Derby Tool
- VectorVest Simulator
- VectorVest Variator
- VectorVest Watchdog
