HOT TOPICS LIST
- MACD
- Fibonacci
- RSI
- Gann
- ADXR
- Stochastics
- Volume
- Triangles
- Futures
- Cycles
- Volatility
- ZIGZAG
- MESA
- Retracement
- Aroon
INDICATORS LIST
LIST OF TOPICS
PRINT THIS ARTICLE
by Kevin Hopson
The Oil Services Index bounced off key support in the 92-93 range last week. Though a further pull back is possible in the near-term, the long-term technicals point to higher prices down the road.
Position: Accumulate
Kevin Hopson
Kevin has been a technical analyst for roughly 10 years now. Previously, Kevin owned his own business and acted as a registered investment advisor, specializing in energy. He was also a freelance oil analyst for Orient Trading Co., a commodity futures trading firm in Japan. Kevin is currently a freelance writer.
PRINT THIS ARTICLE
SUPPORT & RESISTANCE
Oil Services Index Bounces of Key Support
06/23/03 01:23:53 PMby Kevin Hopson
The Oil Services Index bounced off key support in the 92-93 range last week. Though a further pull back is possible in the near-term, the long-term technicals point to higher prices down the road.
Position: Accumulate
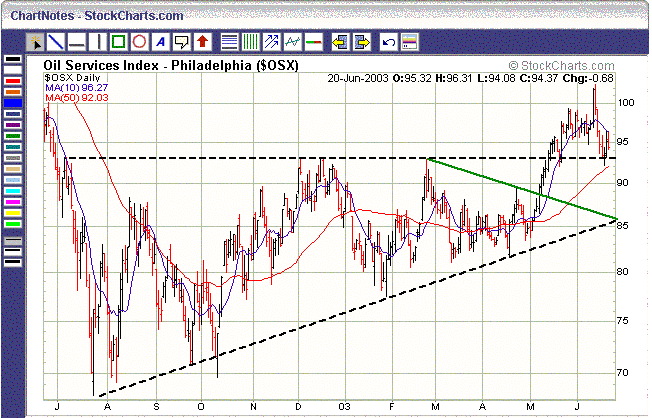
| The Oil Services Index (OSX) has been in a steady uptrend since July of last year. However, the index pulled back significantly last week after hitting a one-year high earlier this month. If you looked at the long-term chart while this correction was playing out, you would have realized that the 92-93 range was a good support area. |
| More specifically, you will notice that the OSX breached a quintuple top at the 93 level in mid-May, effectively breaking out of a ten-month ascending triangle formation - as indicated by the dotted black lines. Since prior resistance levels tend to act as support, investors should have anticipated a bounce off 93. As you can see, this occurred. In fact, the index bounced off this level once before (in mid-May), indicating further support here. Coupled with the index's 50-day moving average (92.03), the 92-93 range was considered a key area of support for the OSX. |

|
| Figure 1: Daily chart for the Philadelphia Oil Services Index ($OSX). |
| Graphic provided by: Stockcharts.com. |
| |
| Now that the OSX has started to move higher, the index is facing near-term resistance around its 10-day moving average (96.27), where it - not coincidentally - topped out last Friday. This price level, along with the index's 20-day moving average (96.78), need to be overcome in the near-term if the OSX is going to proceed higher. Otherwise, a further pull back to the 86 level - site of February's former downtrend line (green line), last July's uptrend line (bottom black dotted line) and the index's 200-day moving average (85.74) - is likely before the long-term uptrend resumes. |
| Either way, I would consider short-term price weakness an excellent buying opportunity. The reason being that the large ascending triangle breakout last month indicates an ultimate upside target of 118. This is calculated by taking the base of the triangle (93-68=25) and adding it to the initial breakout point (93+25=118). Since there seems to be significant upside potential left in oil service stocks and the 86 level will likely act as the ultimate bottom in the near-term, I would look to accumulate these shares. |
Kevin has been a technical analyst for roughly 10 years now. Previously, Kevin owned his own business and acted as a registered investment advisor, specializing in energy. He was also a freelance oil analyst for Orient Trading Co., a commodity futures trading firm in Japan. Kevin is currently a freelance writer.
| Glen Allen, VA | |
| E-mail address: | hopson_1@yahoo.com |
Click here for more information about our publications!
PRINT THIS ARTICLE

|

Request Information From Our Sponsors
- StockCharts.com, Inc.
- Candle Patterns
- Candlestick Charting Explained
- Intermarket Technical Analysis
- John Murphy on Chart Analysis
- John Murphy's Chart Pattern Recognition
- John Murphy's Market Message
- MurphyExplainsMarketAnalysis-Intermarket Analysis
- MurphyExplainsMarketAnalysis-Visual Analysis
- StockCharts.com
- Technical Analysis of the Financial Markets
- The Visual Investor
- VectorVest, Inc.
- Executive Premier Workshop
- One-Day Options Course
- OptionsPro
- Retirement Income Workshop
- Sure-Fire Trading Systems (VectorVest, Inc.)
- Trading as a Business Workshop
- VectorVest 7 EOD
- VectorVest 7 RealTime/IntraDay
- VectorVest AutoTester
- VectorVest Educational Services
- VectorVest OnLine
- VectorVest Options Analyzer
- VectorVest ProGraphics v6.0
- VectorVest ProTrader 7
- VectorVest RealTime Derby Tool
- VectorVest Simulator
- VectorVest Variator
- VectorVest Watchdog
