HOT TOPICS LIST
- MACD
- Fibonacci
- RSI
- Gann
- ADXR
- Stochastics
- Volume
- Triangles
- Futures
- Cycles
- Volatility
- ZIGZAG
- MESA
- Retracement
- Aroon
INDICATORS LIST
LIST OF TOPICS
PRINT THIS ARTICLE
by Kevin Hopson
The AMEX Oil Index looks to be completing a falling wedge formation, which would indicate a potential upside breakout in the near-term.
Position: Accumulate
Kevin Hopson
Kevin has been a technical analyst for roughly 10 years now. Previously, Kevin owned his own business and acted as a registered investment advisor, specializing in energy. He was also a freelance oil analyst for Orient Trading Co., a commodity futures trading firm in Japan. Kevin is currently a freelance writer.
PRINT THIS ARTICLE
WEDGE FORMATIONS
Falling Wedge Formation for the AMEX Oil Index
06/23/03 01:21:52 PMby Kevin Hopson
The AMEX Oil Index looks to be completing a falling wedge formation, which would indicate a potential upside breakout in the near-term.
Position: Accumulate
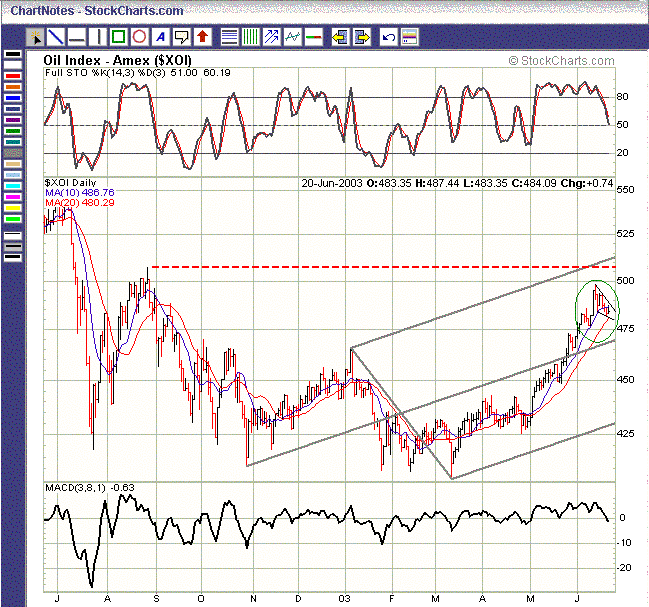
| The AMEX Oil Index (XOI), a price-weighted index of large-cap integrated oil companies, appears to be in the final stages of a falling wedge formation. This is a pattern of lower highs and lower lows. However, unlike a declining channel, the top trend line (lower highs) tends to be at a steeper angle than the bottom trend line (lower lows). Additionally, this pattern is often resolved by a break to the upside. |
| The most logical reversal point would be the index's 20-day moving average (480.29). More specifically, this moving average has acted as ultimate support for the index since May's breakout. Because the 20-day moving average is now coming into play and the falling wedge formation is contracting (trading range is getting tighter), I think the index could see a reversal to the upside very soon. |

|
| Figure 1: Daily chart for the Amex Oil Index ($XOI) |
| Graphic provided by: Stockcharts.com. |
| |
| If so, the 505 to 515 range looks to be a good price target, as this is the site of last August's high and the top parallel line of the gray pitchfork. If you think back to my prior articles on the XOI, you will remember that I considered May's breakout to be the end of the index's two-year downtrend. Since I believe we are in the beginning stages of a long-term uptrend and the technicals point to further price appreciation in the near-term, I would look to accumulate shares of integrated oil stocks on weakness. |
Kevin has been a technical analyst for roughly 10 years now. Previously, Kevin owned his own business and acted as a registered investment advisor, specializing in energy. He was also a freelance oil analyst for Orient Trading Co., a commodity futures trading firm in Japan. Kevin is currently a freelance writer.
| Glen Allen, VA | |
| E-mail address: | hopson_1@yahoo.com |
Click here for more information about our publications!
Comments
Date: 06/26/03Rank: 5Comment:

Request Information From Our Sponsors
- StockCharts.com, Inc.
- Candle Patterns
- Candlestick Charting Explained
- Intermarket Technical Analysis
- John Murphy on Chart Analysis
- John Murphy's Chart Pattern Recognition
- John Murphy's Market Message
- MurphyExplainsMarketAnalysis-Intermarket Analysis
- MurphyExplainsMarketAnalysis-Visual Analysis
- StockCharts.com
- Technical Analysis of the Financial Markets
- The Visual Investor
- VectorVest, Inc.
- Executive Premier Workshop
- One-Day Options Course
- OptionsPro
- Retirement Income Workshop
- Sure-Fire Trading Systems (VectorVest, Inc.)
- Trading as a Business Workshop
- VectorVest 7 EOD
- VectorVest 7 RealTime/IntraDay
- VectorVest AutoTester
- VectorVest Educational Services
- VectorVest OnLine
- VectorVest Options Analyzer
- VectorVest ProGraphics v6.0
- VectorVest ProTrader 7
- VectorVest RealTime Derby Tool
- VectorVest Simulator
- VectorVest Variator
- VectorVest Watchdog
