HOT TOPICS LIST
- MACD
- Fibonacci
- RSI
- Gann
- ADXR
- Stochastics
- Volume
- Triangles
- Futures
- Cycles
- Volatility
- ZIGZAG
- MESA
- Retracement
- Aroon
INDICATORS LIST
LIST OF TOPICS
PRINT THIS ARTICLE
by Gary Grosschadl
Too many negative divergences to recent movement has this index due for a haircut.
Position: N/A
Gary Grosschadl
Independent Canadian equities trader and technical analyst based in Peterborough
Ontario, Canada.
PRINT THIS ARTICLE
CHART ANALYSIS
Is Nasdaq Due For Retracement?
06/23/03 03:59:29 PMby Gary Grosschadl
Too many negative divergences to recent movement has this index due for a haircut.
Position: N/A
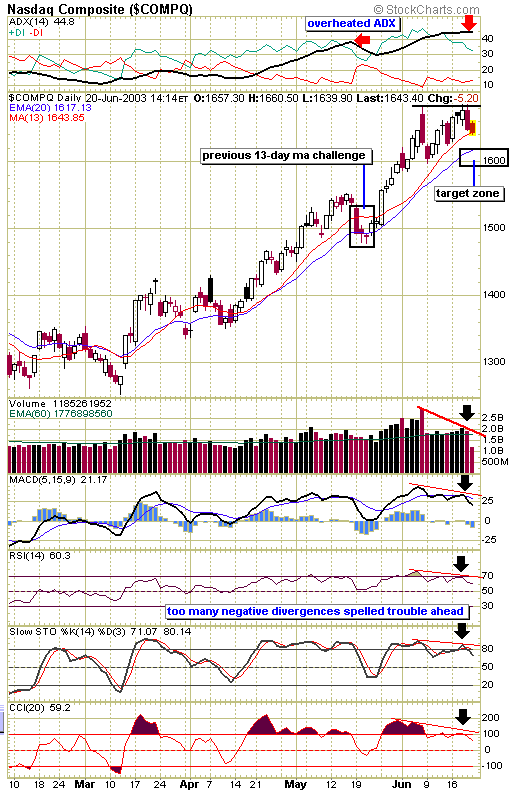
| When indexes or stocks rise to meet or exceed previous highs, volume and other indicators should collaborate the bullish intent. If not, the rise is suspect and a retracement possibility exists. The chart shows this tech heavy index rising to test a recent high but on lower volume. This often means that the bulls have less conviction than before, making the rise suspect. The displayed indicators give ample further proof that all is not well in convincing the bulls that this is sustainable at least in the short term via the daily chart. |
| The directional movement indicator on top of the chart also gives reason for concern. Anytime the ADX component moves above both DIs it is considered overheated and volatile action can ensue. When ADX peaks and reverses in this zone it usually indicates the existing or previous trend is about to reverse. This chart is a good example of what can transpire short of an actual crossing of the DI components. A more serious trend reversal usually has the DIs actually cross and with the bearish -DI on top, the decline is set to continue. If on the other hand, the DI's refuse to cross, it is indicative of a brief retracement followed by a resumption of the previous bullish trend. Note how the ADX once again reversed in the chart example labelled "previous 13-day ma challenge" and the bullish upleg resumed. |

|
| Nasdaq daily chart. |
| Graphic provided by: stockcharts.com. |
| |
| If this turns out to be another successful test of nearby moving averages we can expect similar action from the DMI or directional movement indicator. This is an excellent tool to show trend strength in strongly trending markets. However should the Nasdaq move below the target area it will probably be accompanied by the tell tale cross of the DIs as previously discussed, giving the bears control over the bulls in this daily time frame. |
| These days the main indexes show little imagination of their own, so similar observations can also be made of the Dow and S&P 500. |
Independent Canadian equities trader and technical analyst based in Peterborough
Ontario, Canada.
| Website: | www.whatsonsale.ca/financial.html |
| E-mail address: | gwg7@sympatico.ca |
Click here for more information about our publications!
Comments
Date: 06/24/03Rank: 5Comment:
Date: 06/24/03Rank: 5Comment:
Date: 06/24/03Rank: 5Comment:
Date: 06/29/03Rank: 5Comment:

|

Request Information From Our Sponsors
- StockCharts.com, Inc.
- Candle Patterns
- Candlestick Charting Explained
- Intermarket Technical Analysis
- John Murphy on Chart Analysis
- John Murphy's Chart Pattern Recognition
- John Murphy's Market Message
- MurphyExplainsMarketAnalysis-Intermarket Analysis
- MurphyExplainsMarketAnalysis-Visual Analysis
- StockCharts.com
- Technical Analysis of the Financial Markets
- The Visual Investor
- VectorVest, Inc.
- Executive Premier Workshop
- One-Day Options Course
- OptionsPro
- Retirement Income Workshop
- Sure-Fire Trading Systems (VectorVest, Inc.)
- Trading as a Business Workshop
- VectorVest 7 EOD
- VectorVest 7 RealTime/IntraDay
- VectorVest AutoTester
- VectorVest Educational Services
- VectorVest OnLine
- VectorVest Options Analyzer
- VectorVest ProGraphics v6.0
- VectorVest ProTrader 7
- VectorVest RealTime Derby Tool
- VectorVest Simulator
- VectorVest Variator
- VectorVest Watchdog
