HOT TOPICS LIST
- MACD
- Fibonacci
- RSI
- Gann
- ADXR
- Stochastics
- Volume
- Triangles
- Futures
- Cycles
- Volatility
- ZIGZAG
- MESA
- Retracement
- Aroon
INDICATORS LIST
LIST OF TOPICS
PRINT THIS ARTICLE
by David Penn
After a rally in late spring, coffee futures are making new contract lows. What will it take for a turnaround?
Position: N/A
David Penn
Technical Writer for Technical Analysis of STOCKS & COMMODITIES magazine, Working-Money.com, and Traders.com Advantage.
PRINT THIS ARTICLE
VOLUME OSCILLATOR
Coffee Grinding Down
06/23/03 10:57:41 AMby David Penn
After a rally in late spring, coffee futures are making new contract lows. What will it take for a turnaround?
Position: N/A
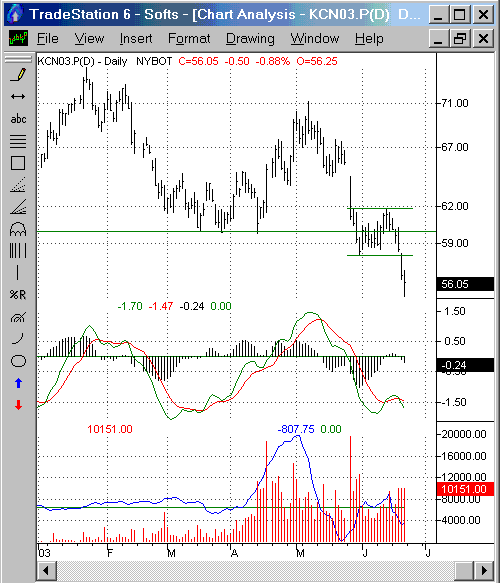
| About six weeks ago, I suggested that a successful 2B test of bottom was in store for coffee futures ("May Coffee's 2B Test," Traders.com Advantage, April 7, 2003). Although coffee ended up testing that bottom one time more than I pointed to (the late March low was followed by successful test in mid-April), coffee futures did indeed head higher, moving from lows just under 60 to a high of 71 (basis July). |
| But those bullish days have been hard to come by since. After peaking out at 71 early in May, July coffee revisited the previous lows--actually establishing new contract lows in June. In a sense, the July 2003 coffee contract has come first circle, having been at approximately these low levels (around 56) one year ago. |

|
| A higher trough in the MACD would help build the case for a turnaround in coffee. |
| Graphic provided by: TradeStation. |
| |
| Will the coffee bear market end with a bang or a whimper? Right now, volume seems to suggest that a whimpering end is more likely than other alternatives. Coffee futures have continued to drift lower since their initial break late in May and in mid-June fell out of a two-week consolidation range between, roughly, 62 and 58. This suggests that 54 might be a level of potential support. |
| While waiting to see what happens between current prices and this to-be-tested support level, watching to see whether or not the MACD indicator makes a new trough low in late June will be another indicator as to where July coffee's bear market might, even temporarily end. Note how the rising series of MACD troughs in March and April anticipated coffee's break to the upside in late April and May. |
| An additional factor is the volume oscillator, shown in blue and superimposed on volume. The volume oscillator simply compares to exponential moving averages of volume, one moving average that is short in duration and one that is longer. Here, 14 and 28 period moving averages are used, though I have seen combinations of 5 and 20 used also. The volume oscillator tends to lead prices: in bull markets, the volume oscillator should be moving up and in bear markets, the volume oscillator should be moving down. Typical divergences occur when prices are moving up dramatically, while the volume oscillator is moving downward, or when prices are moving downward dramatically, while the volume oscillator is moving upward. In these two cases, prices and volume are not "in gear" and reversals in price action are more likely. This is to say that, with the volume oscillator making higher lows (late May versus late June), a significant upthrust in the oscillator during the current decline in coffee prices could signal a short-term bottom and possible reversal in trend. |
Technical Writer for Technical Analysis of STOCKS & COMMODITIES magazine, Working-Money.com, and Traders.com Advantage.
| Title: | Technical Writer |
| Company: | Technical Analysis, Inc. |
| Address: | 4757 California Avenue SW |
| Seattle, WA 98116 | |
| Phone # for sales: | 206 938 0570 |
| Fax: | 206 938 1307 |
| Website: | www.Traders.com |
| E-mail address: | DPenn@traders.com |
Traders' Resource Links | |
| Charting the Stock Market: The Wyckoff Method -- Books | |
| Working-Money.com -- Online Trading Services | |
| Traders.com Advantage -- Online Trading Services | |
| Technical Analysis of Stocks & Commodities -- Publications and Newsletters | |
| Working Money, at Working-Money.com -- Publications and Newsletters | |
| Traders.com Advantage -- Publications and Newsletters | |
| Professional Traders Starter Kit -- Software | |
Click here for more information about our publications!
PRINT THIS ARTICLE

Request Information From Our Sponsors
- StockCharts.com, Inc.
- Candle Patterns
- Candlestick Charting Explained
- Intermarket Technical Analysis
- John Murphy on Chart Analysis
- John Murphy's Chart Pattern Recognition
- John Murphy's Market Message
- MurphyExplainsMarketAnalysis-Intermarket Analysis
- MurphyExplainsMarketAnalysis-Visual Analysis
- StockCharts.com
- Technical Analysis of the Financial Markets
- The Visual Investor
- VectorVest, Inc.
- Executive Premier Workshop
- One-Day Options Course
- OptionsPro
- Retirement Income Workshop
- Sure-Fire Trading Systems (VectorVest, Inc.)
- Trading as a Business Workshop
- VectorVest 7 EOD
- VectorVest 7 RealTime/IntraDay
- VectorVest AutoTester
- VectorVest Educational Services
- VectorVest OnLine
- VectorVest Options Analyzer
- VectorVest ProGraphics v6.0
- VectorVest ProTrader 7
- VectorVest RealTime Derby Tool
- VectorVest Simulator
- VectorVest Variator
- VectorVest Watchdog
