HOT TOPICS LIST
- MACD
- Fibonacci
- RSI
- Gann
- ADXR
- Stochastics
- Volume
- Triangles
- Futures
- Cycles
- Volatility
- ZIGZAG
- MESA
- Retracement
- Aroon
INDICATORS LIST
LIST OF TOPICS
PRINT THIS ARTICLE
by Koos van der Merwe
A reader of Traders.com applied the cycle strategy I used of previous articles (Nasdaq And Cycles of December, 2002) to the London Gold price, and emailed it to me for comment. Below is my analysis.
Position: N/A
Koos van der Merwe
Has been a technical analyst since 1969, and has worked as a futures and options trader with First Financial Futures in Johannesburg, South Africa.
PRINT THIS ARTICLE
CYCLES
What Is It With Gold?
06/18/03 10:28:18 AMby Koos van der Merwe
A reader of Traders.com applied the cycle strategy I used of previous articles (Nasdaq And Cycles of December, 2002) to the London Gold price, and emailed it to me for comment. Below is my analysis.
Position: N/A
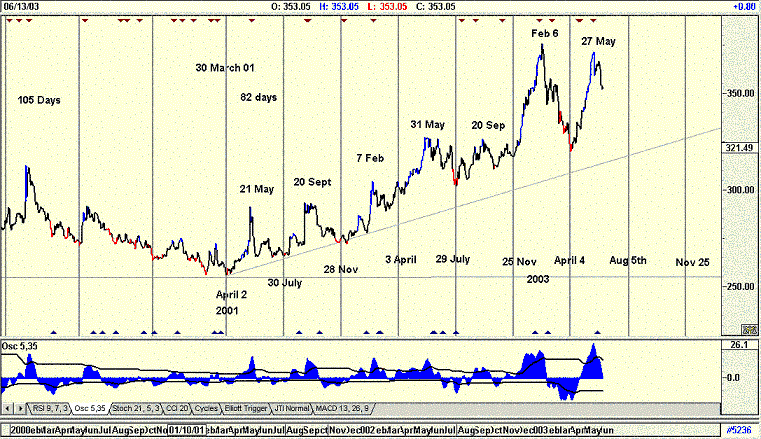
| The cycle as shown on the chart is interesting for the following reasons. Prior to April 2001, the cycle periods were 105 days between lows, with the high point in the cycle favoring the left side of each cycle. This is typical of a Bear market, and London gold fix duly fell to a low of $256.27 |
| However, as you can see in the chart, since April 2, 2001 the cycle parameter has changed to 82 days between lows, with the highs of the cycle, being at the 50% mark, that is, half way in the cycle. This suggests indecisiveness, with the gold neither bullish nor bearish, yet as we can see from the chart, the price of gold rose to a high of $376.57 on February 6, 2003. |

|
| Figure 1: The regularity of the present London Gold Cycle |
| Graphic provided by: AdvancedGET. |
| |
| What is even more confusing is that the dates of the highs and lows are consistant, e.g. the low of April 2, 2001; April 3, 2002 and April 4, 2003. This regularity is also found on the highs give or take 1-2 days, e.g. the high of May 21, 2001; the high of May 31, 2002 and the high of May 27, 2003. Also look at the highs of February 7, 2002 and February 6, 2003 and the lows of November 28, 2001 and the November 25, 2002. |
| Does this mean that we can expect a low around late July/early August of this year; a high around September 20, followed by a low in late November and another high in February 2004? Regularity of this nature in a market disturbs me, and bears deeper investigation. What caused the cycle to change on April 2, 2001 and regularity to appear? Can this regularity be depended on or will the cycle change sometime in the future? These are questions that should be answered. |
| Finally, I did look at the US$ cycle and considered the performance of gold in Euros. The Euro is following a 78 day cycle, which is close enough, but its highs lean to the right of the cycle, suggesting bullishness, and not the middle as with gold. I can only assume that the regularity could be Central Bank buying and selling, which would follow the regularity of civil servant formality, and I will look into this further. I leave this question open to readers, and any input here will be welcome, and a challenge. |
Has been a technical analyst since 1969, and has worked as a futures and options trader with First Financial Futures in Johannesburg, South Africa.
| Address: | 3256 West 24th Ave |
| Vancouver, BC | |
| Phone # for sales: | 6042634214 |
| E-mail address: | petroosp@gmail.com |
Click here for more information about our publications!
Comments
Date: 06/19/03Rank: 3Comment:
Date: 06/20/03Rank: 3Comment:
Date: 06/24/03Rank: 5Comment:
Date: 06/24/03Rank: 4Comment:

Request Information From Our Sponsors
- StockCharts.com, Inc.
- Candle Patterns
- Candlestick Charting Explained
- Intermarket Technical Analysis
- John Murphy on Chart Analysis
- John Murphy's Chart Pattern Recognition
- John Murphy's Market Message
- MurphyExplainsMarketAnalysis-Intermarket Analysis
- MurphyExplainsMarketAnalysis-Visual Analysis
- StockCharts.com
- Technical Analysis of the Financial Markets
- The Visual Investor
- VectorVest, Inc.
- Executive Premier Workshop
- One-Day Options Course
- OptionsPro
- Retirement Income Workshop
- Sure-Fire Trading Systems (VectorVest, Inc.)
- Trading as a Business Workshop
- VectorVest 7 EOD
- VectorVest 7 RealTime/IntraDay
- VectorVest AutoTester
- VectorVest Educational Services
- VectorVest OnLine
- VectorVest Options Analyzer
- VectorVest ProGraphics v6.0
- VectorVest ProTrader 7
- VectorVest RealTime Derby Tool
- VectorVest Simulator
- VectorVest Variator
- VectorVest Watchdog
