HOT TOPICS LIST
- MACD
- Fibonacci
- RSI
- Gann
- ADXR
- Stochastics
- Volume
- Triangles
- Futures
- Cycles
- Volatility
- ZIGZAG
- MESA
- Retracement
- Aroon
INDICATORS LIST
LIST OF TOPICS
PRINT THIS ARTICLE
by Matt Blackman
Much of technical analysis is subjective so that often the value of the signal is in the eye of the beholder. However, when multiple indicators are saying the same thing on a weekly or monthly chart, the signal is much harder to ignore.
Position: Sell
Matt Blackman
Matt Blackman is a full-time technical and financial writer and trader. He produces corporate and financial newsletters, and assists clients in getting published in the mainstream media. He is the host of TradeSystemGuru.com. Matt has earned the Chartered Market Technician (CMT) designation. Find out what stocks and futures Matt is watching on Twitter at www.twitter.com/RatioTrade
PRINT THIS ARTICLE
CANDLESTICK CHARTING
Complex Candlestick Patterns Scream 'Sell'
06/12/03 09:50:43 AMby Matt Blackman
Much of technical analysis is subjective so that often the value of the signal is in the eye of the beholder. However, when multiple indicators are saying the same thing on a weekly or monthly chart, the signal is much harder to ignore.
Position: Sell
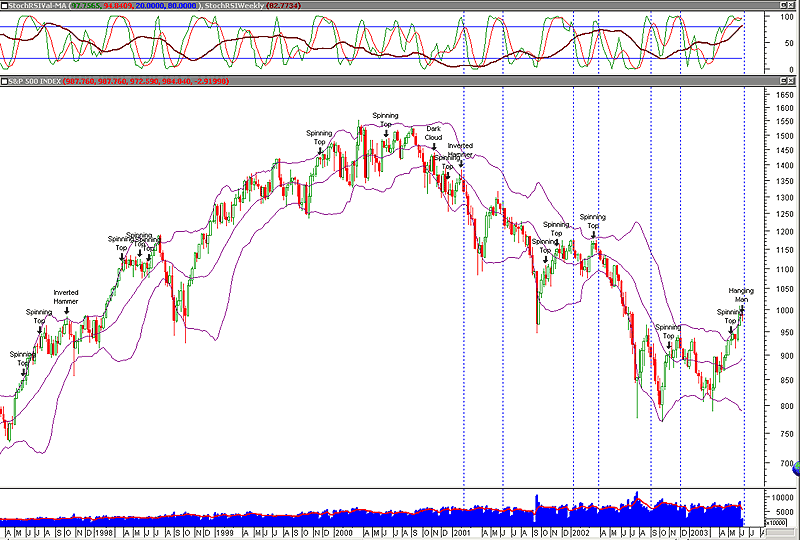
| At the risk of impersonating Chicken Little (I first began warning that the market was overbought in mid-May), complex bearish candlestick patterns together with the stochasticRSI momentum indicator are screaming "sell" on the weekly chart of the S&P 500 Index (SPX). Based on past accuracy of these signals, they should not be ignored. In the case of the charts below, not one false sell signal has been generated in the last 36 months when used in conjunction with the stochasticRSI. |
| The candlestick signals in Figure 1 were designed by combining the various bearish candlestick indicators in Metastock with a rising median price for each of the three weeks leading up to the candlestick pattern so that a signal was generated only if it was preceded by a three-week rise in the average price of the index. For example, here is the Metastock formula language for the Spinning Top: SpinningTop() AND Ref(MP(),-1)>Ref(MP(),-2) AND Ref(MP(),-2)>Ref(MP(),-3) AND Ref(MP(),-1)>Ref(MP(),-3) AND CLOSE>Ref(C,-3) Anytime another indicator, such as the stochasticRSI, corroborates a complex candlestick signal, it becomes more powerful. It is another fact of technical analysis that the longer the period being used (eg. weekly versus daily) the more powerful the signal as well. To increase the chance of winning, a signal should not be acted upon without a break in the trendline extending from the bottom of the large green rising window on March 21 to just below the low of the hanging man on June 10th. |

|
| Figure 1 – Weekly chart of the S&P500 (SPX) showing complex bearish hanging man, spinning top and inverted hammer signals. Note that each time the weekly stochasticRSI (upper window) generated a sell signal in the last two years (see vertical dotted lines), the price of the index dropped significantly. |
| Graphic provided by: MetaStock. |
| |
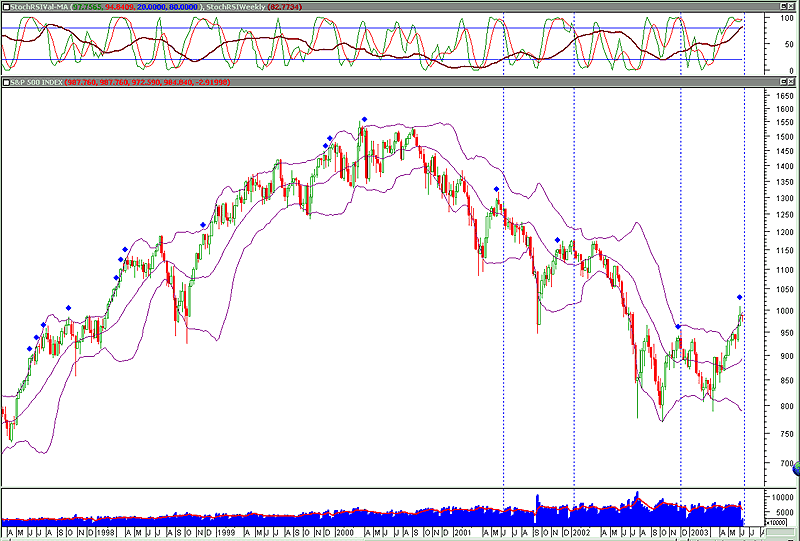
 Figure 2 - Same chart of the weekly SPX but this time showing bearish candlestick patterns (blue diamonds) from the Nison Candlesticks Unleashed (NCU) plug-in for Metastock. Note that each time a signal was generated in the last two years, it was confirmed by a weekly stochasticRSI sell signal. Both Figures 1 and 2 generated sell signals for the week ending June 6, 2003. |
| One final thought, the bears have dominated the past 36 months. Any coming correction will test whether they have gone into a long-term hibernation or are just napping. If this candlestick/stochasticRSI sell signal results in a brief retracement or sideways action and no significant drop results, it will be another convincing sign that market sentiment has changed for the better. |
Matt Blackman is a full-time technical and financial writer and trader. He produces corporate and financial newsletters, and assists clients in getting published in the mainstream media. He is the host of TradeSystemGuru.com. Matt has earned the Chartered Market Technician (CMT) designation. Find out what stocks and futures Matt is watching on Twitter at www.twitter.com/RatioTrade
| Company: | TradeSystemGuru.com |
| Address: | Box 2589 |
| Garibaldi Highlands, BC Canada | |
| Phone # for sales: | 604-898-9069 |
| Fax: | 604-898-9069 |
| Website: | www.tradesystemguru.com |
| E-mail address: | indextradermb@gmail.com |
Traders' Resource Links | |
| TradeSystemGuru.com has not added any product or service information to TRADERS' RESOURCE. | |
Click here for more information about our publications!
Comments
Date: 06/16/03Rank: 1Comment: Candle chart to small to see
Date: 06/17/03Rank: 4Comment:
Date: 06/17/03Rank: 3Comment:
Date: 06/19/03Rank: 4Comment:
Date: 06/27/03Rank: 5Comment:

|

Request Information From Our Sponsors
- StockCharts.com, Inc.
- Candle Patterns
- Candlestick Charting Explained
- Intermarket Technical Analysis
- John Murphy on Chart Analysis
- John Murphy's Chart Pattern Recognition
- John Murphy's Market Message
- MurphyExplainsMarketAnalysis-Intermarket Analysis
- MurphyExplainsMarketAnalysis-Visual Analysis
- StockCharts.com
- Technical Analysis of the Financial Markets
- The Visual Investor
- VectorVest, Inc.
- Executive Premier Workshop
- One-Day Options Course
- OptionsPro
- Retirement Income Workshop
- Sure-Fire Trading Systems (VectorVest, Inc.)
- Trading as a Business Workshop
- VectorVest 7 EOD
- VectorVest 7 RealTime/IntraDay
- VectorVest AutoTester
- VectorVest Educational Services
- VectorVest OnLine
- VectorVest Options Analyzer
- VectorVest ProGraphics v6.0
- VectorVest ProTrader 7
- VectorVest RealTime Derby Tool
- VectorVest Simulator
- VectorVest Variator
- VectorVest Watchdog
