HOT TOPICS LIST
- MACD
- Fibonacci
- RSI
- Gann
- ADXR
- Stochastics
- Volume
- Triangles
- Futures
- Cycles
- Volatility
- ZIGZAG
- MESA
- Retracement
- Aroon
INDICATORS LIST
LIST OF TOPICS
PRINT THIS ARTICLE
by Gary Grosschadl
Does Citigroup (C) have enough power to keep on going?
Position: Hold
Gary Grosschadl
Independent Canadian equities trader and technical analyst based in Peterborough
Ontario, Canada.
PRINT THIS ARTICLE
CHART ANALYSIS
Citigroup Breaks a Three Year Trendline
06/12/03 09:08:58 AMby Gary Grosschadl
Does Citigroup (C) have enough power to keep on going?
Position: Hold
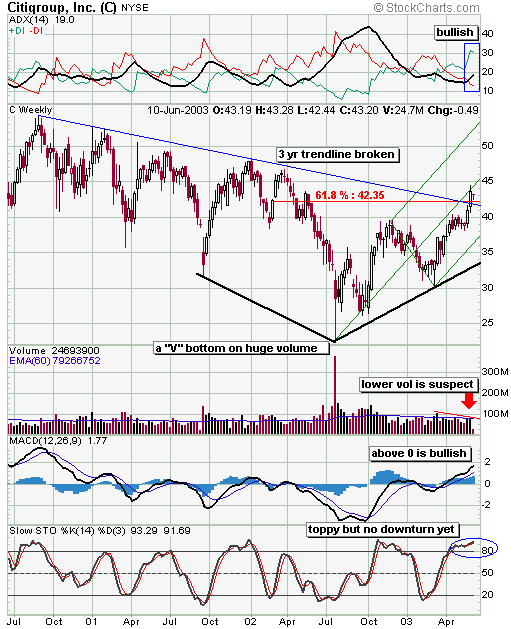
| This weekly chart shows this stock making a breakout attempt from a multi-year trendline. This is bullish but there are a few concerns. It has certainly made tremendous gains off its V-type bottom on huge volume and off a bottom hammer last July. However it may be due for some consolidation here. |
| Citigroup has hit two other milestones besides the trendline break. It has reached and exceeded an important Fibonacci resistance level - the 61.8% mark. This is measured between the high and low of the chart. It has also made a successful move to the green pitchfork's median line. When this center line is hit it often signals a retracement or at least some sideways consolidation. What is troublesome is that all these milestones have ocurred at relatively unexceptional volume when compared to its historical average. This suggests a lack of bullish conviction and hints at a tired advance perhaps needing a breather. |

|
| Weekly chart for Citigroup Inc. |
| Graphic provided by: Stockcharts.com. |
| |
| Looking at the uppermost indicator, the profile is bullish with +DI on top and ADX in between and upsloping but the ADX is not very strong here at 19. A move to 25-30 would show a stronger trend, so trend strength needs to improve to be more convincing. The MACD or moving average convergence/divergence is in good shape, however below it, stochastics are in overbought territory. A downturn from here will eventually occur and buying at lower stochastic levels is usually much safer. |
| Since bottoming each strong advance has been followed by a period of consolidation and this is likely to happen again. The stock could go on to move higher but with the volume concern, high stochastics, and the median line target hit it would be more prudent to wait and see how the next retracement is handled. If for any reason the stock quickly retreats below $42, warning bells should ring, indicating a possible false breakout and downside action coming. |
Independent Canadian equities trader and technical analyst based in Peterborough
Ontario, Canada.
| Website: | www.whatsonsale.ca/financial.html |
| E-mail address: | gwg7@sympatico.ca |
Click here for more information about our publications!
Comments
Date: 06/12/03Rank: 5Comment:
Date: 06/12/03Rank: 5Comment:
Date: 06/27/03Rank: 4Comment:

Request Information From Our Sponsors
- VectorVest, Inc.
- Executive Premier Workshop
- One-Day Options Course
- OptionsPro
- Retirement Income Workshop
- Sure-Fire Trading Systems (VectorVest, Inc.)
- Trading as a Business Workshop
- VectorVest 7 EOD
- VectorVest 7 RealTime/IntraDay
- VectorVest AutoTester
- VectorVest Educational Services
- VectorVest OnLine
- VectorVest Options Analyzer
- VectorVest ProGraphics v6.0
- VectorVest ProTrader 7
- VectorVest RealTime Derby Tool
- VectorVest Simulator
- VectorVest Variator
- VectorVest Watchdog
- StockCharts.com, Inc.
- Candle Patterns
- Candlestick Charting Explained
- Intermarket Technical Analysis
- John Murphy on Chart Analysis
- John Murphy's Chart Pattern Recognition
- John Murphy's Market Message
- MurphyExplainsMarketAnalysis-Intermarket Analysis
- MurphyExplainsMarketAnalysis-Visual Analysis
- StockCharts.com
- Technical Analysis of the Financial Markets
- The Visual Investor
