

HOT TOPICS LIST
- MACD
- Fibonacci
- RSI
- Gann
- ADXR
- Stochastics
- Volume
- Triangles
- Futures
- Cycles
- Volatility
- ZIGZAG
- MESA
- Retracement
- Aroon
INDICATORS LIST
LIST OF TOPICS
PRINT THIS ARTICLE
by Gary Grosschadl
A topping pattern may be in for this freight transportation company owning the largest rail network in the eastern United States.
Position: Hold
Gary Grosschadl
Independent Canadian equities trader and technical analyst based in Peterborough
Ontario, Canada.
PRINT THIS ARTICLE
CHART ANALYSIS
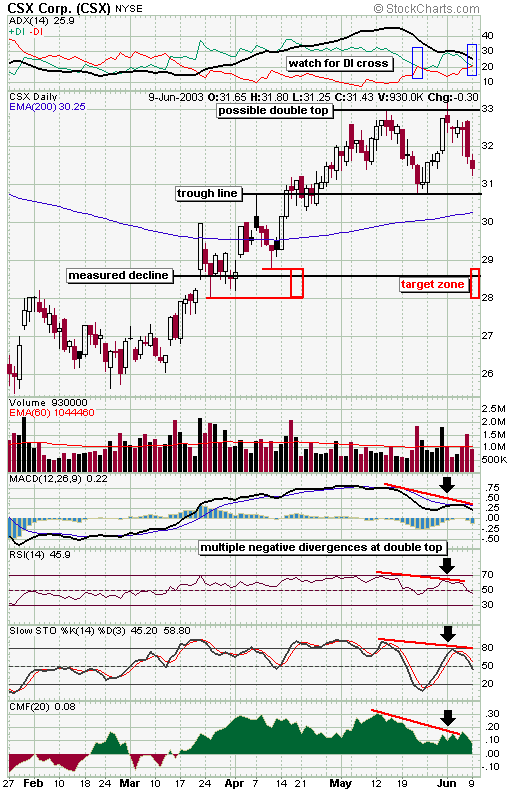
Possible Double Top For CSX Corp.
06/11/03 10:51:22 AMby Gary Grosschadl
A topping pattern may be in for this freight transportation company owning the largest rail network in the eastern United States.
Position: Hold
| A double top is properly confirmed only when the trough line (between the peaks) is broken and this test is coming soon for CSX Corp. (CSX). There are a few signs that this current downleg may have the bearish potential to confirm the double top possibility. |
| Several indicators are showing bearish possibilities. The directional movement indicator on the top of the chart shows the DI components on the verge of crossing. A cross here (-DI on top of +DI) represents the bears gaining the upper hand over the bulls. The last time this nearly occurred, the stock was already at the trough line. Now it appears likely to do a bearish cross before that potential support line is reached, signaling a greater bearish potential and less likelihood of support holding. The displayed indicators under the chart all show a negative divergence to price action at those two tops. When prices hit a previous or new high and several indicators fail to confirm with similar action, then a downleg is likely to occur, as is happenning now. How far this goes still remains to be seen. |
|
| Daily chart for CSX Corp. |
| Graphic provided by: Stockcharts.com. |
| |
| Note that the CMF or Chaikin Money Flow indicator also shows this negative divergence. The CMF is quite dissimilar to the other indicators. Rather than being a momentum type oscillator, the CMF is an indication of buying and selling pressure. We see much less buying pressure here than at the previous top and this is bearish. A further breakdown in the chart pattern should result in the CMF going under zero to negative territory. Failure to do so may, on the other hand, point to some latent bullishness. |
| If the trough line does break confirming the double top, then a target area is outlined. The measured decline for this potential reversal pattern is $2.20, the distance from the top to the trough line. This is then applied to the trough line on the downside bringing it to $28.60. Since this is an estimation I prefer to give it a target zone between two previous bottom hammers in the vicinity of the measured decline, this zone being between $28.00 - $28.80. |
| I have indicated the stock as a hold rather than a sell because it is prudent to wait for actual confirmation of the surmised double top. Traders should watch this trough area before committing themselves either way as the market will show its hand eventually. |
Independent Canadian equities trader and technical analyst based in Peterborough
Ontario, Canada.
| Website: | www.whatsonsale.ca/financial.html |
| E-mail address: | gwg7@sympatico.ca |
Click here for more information about our publications!
Comments
Date:�06/14/03Rank:�5Comment:�
Date:�06/27/03Rank:�5Comment:�

Request Information From Our Sponsors
- StockCharts.com, Inc.
- Candle Patterns
- Candlestick Charting Explained
- Intermarket Technical Analysis
- John Murphy on Chart Analysis
- John Murphy's Chart Pattern Recognition
- John Murphy's Market Message
- MurphyExplainsMarketAnalysis-Intermarket Analysis
- MurphyExplainsMarketAnalysis-Visual Analysis
- StockCharts.com
- Technical Analysis of the Financial Markets
- The Visual Investor
- VectorVest, Inc.
- Executive Premier Workshop
- One-Day Options Course
- OptionsPro
- Retirement Income Workshop
- Sure-Fire Trading Systems (VectorVest, Inc.)
- Trading as a Business Workshop
- VectorVest 7 EOD
- VectorVest 7 RealTime/IntraDay
- VectorVest AutoTester
- VectorVest Educational Services
- VectorVest OnLine
- VectorVest Options Analyzer
- VectorVest ProGraphics v6.0
- VectorVest ProTrader 7
- VectorVest RealTime Derby Tool
- VectorVest Simulator
- VectorVest Variator
- VectorVest Watchdog