

HOT TOPICS LIST
- MACD
- Fibonacci
- RSI
- Gann
- ADXR
- Stochastics
- Volume
- Triangles
- Futures
- Cycles
- Volatility
- ZIGZAG
- MESA
- Retracement
- Aroon
INDICATORS LIST
LIST OF TOPICS
PRINT THIS ARTICLE
by David Penn
Bearish in February, bullish in May, is it time to get bearish again on copper futures?
Position: N/A
David Penn
Technical Writer for Technical Analysis of STOCKS & COMMODITIES magazine, Working-Money.com, and Traders.com Advantage.
PRINT THIS ARTICLE
GAPS
The Return of Copper Tops
06/11/03 10:49:02 AMby David Penn
Bearish in February, bullish in May, is it time to get bearish again on copper futures?
Position: N/A
| Copper futures are one of the areas that I've spent a considerable amount of time studying in 2003. In February, I suggested in "Copper Tops" (Traders.com Advantage, February 28, 2003) that a 1-2-3 trend reversal and successful 2B test of top pointed toward lower prices for copper futures. (Note: by "successful" here, I mean that the old top essentially held and prices moved lower.) After that article appeared, copper futures (basis March) fell from 0.7730 to a close of 0.7290 on expiration. As subsequent contracts revealed, copper had further to fall. Basis July, copper futures fell from a March expiration date close of 0.7355 to a low close of 0.7190 approximately thirty days later. |
| About two weeks after copper futures made their late April bottom, I wrote a follow-up that suggested that a reversal in copper was increasingly likely. This reversal was based on a number of factors: a moving average convergence/divergence (MACD) that was rising above the zero line and had made a positive divergence relative to the bottoming copper futures, a successful 2B test of bottom that suggested higher prices, and price action that had formed both an island reversal bottom and a double bottom ("Copper Comes Back," Traders.com Advantage, May 15, 2003). The confluence of these technical indicators and chart patterns suggested a minimum advance in copper futures to around 0.7805. As May continued, copper futures (basis July) did in fact rally higher, finally peaking out late in the month around 0.7930. These highs took out the March 2003 highs in copper, but did not catch the contract highs set in February around 0.8060. |
|
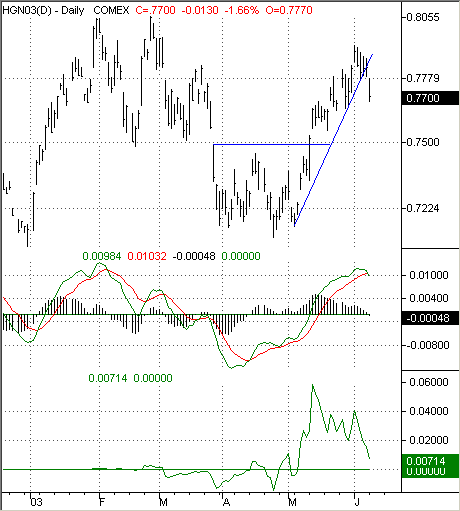
| As the MACD rounds over and the Herrick Payoff Index slashes downward, July copper gaps down beneath a month-long uptrend line. |
| Graphic provided by: TradeStation. |
| |
| Looking at copper futures here in the early summer, it appears that it may be time to become bearish once again. The most immediate reason for this bearishness is the way that prices gapped down beneath a signficant (in this case, month-long) uptrend line. If trendline breaks are signficant, and gaps are significant, then the combination of a gap down beneath an uptrend line--it seems to me--is all the more significant. However, there are a number of other factors--two of which are displayed here in the form of the MACD indicator and John Herrick's Herrick Payoff Index--that also support bearish thinking on copper. |
| Note first the MACD indicator, which appears to be rounding over as prices gapped down in the second week of June. In fact, the MACD was already rounding over somewhat before the sharp move to the downside. Also, note how copper futures (again, basis July) recorded steadily lower highs ever since making a peak at 0.7930. Herrick's Payoff Index also underscores the increasingly bearish situation for July copper. The Payoff Index (or HPI) peaked with the dramatic breakout move from the April double bottom/island reversal mentioned previously. While the HPI has risen and fallen since that time, the lows in the HPI were lower following each spike in the HPI. That the HPI has dropped so sharply on the gap down move--a sharp drop that took out the previous lows set by the intra-spike troughs in the second half of May--is another strong indication that copper prices are headed lower. |
| If copper prices do continue to move lower, then what sort of downside might be expected? The most obvious target is the April low of 0.7105, some six hundred points from recent levels. |
Technical Writer for Technical Analysis of STOCKS & COMMODITIES magazine, Working-Money.com, and Traders.com Advantage.
| Title: | Technical Writer |
| Company: | Technical Analysis, Inc. |
| Address: | 4757 California Avenue SW |
| Seattle, WA 98116 | |
| Phone # for sales: | 206 938 0570 |
| Fax: | 206 938 1307 |
| Website: | www.Traders.com |
| E-mail address: | DPenn@traders.com |
Traders' Resource Links | |
| Charting the Stock Market: The Wyckoff Method -- Books | |
| Working-Money.com -- Online Trading Services | |
| Traders.com Advantage -- Online Trading Services | |
| Technical Analysis of Stocks & Commodities -- Publications and Newsletters | |
| Working Money, at Working-Money.com -- Publications and Newsletters | |
| Traders.com Advantage -- Publications and Newsletters | |
| Professional Traders Starter Kit -- Software | |
Click here for more information about our publications!
Comments
Date:�06/19/03Rank:�3Comment:�

Request Information From Our Sponsors
- StockCharts.com, Inc.
- Candle Patterns
- Candlestick Charting Explained
- Intermarket Technical Analysis
- John Murphy on Chart Analysis
- John Murphy's Chart Pattern Recognition
- John Murphy's Market Message
- MurphyExplainsMarketAnalysis-Intermarket Analysis
- MurphyExplainsMarketAnalysis-Visual Analysis
- StockCharts.com
- Technical Analysis of the Financial Markets
- The Visual Investor
- VectorVest, Inc.
- Executive Premier Workshop
- One-Day Options Course
- OptionsPro
- Retirement Income Workshop
- Sure-Fire Trading Systems (VectorVest, Inc.)
- Trading as a Business Workshop
- VectorVest 7 EOD
- VectorVest 7 RealTime/IntraDay
- VectorVest AutoTester
- VectorVest Educational Services
- VectorVest OnLine
- VectorVest Options Analyzer
- VectorVest ProGraphics v6.0
- VectorVest ProTrader 7
- VectorVest RealTime Derby Tool
- VectorVest Simulator
- VectorVest Variator
- VectorVest Watchdog