HOT TOPICS LIST
- MACD
- Fibonacci
- RSI
- Gann
- ADXR
- Stochastics
- Volume
- Triangles
- Futures
- Cycles
- Volatility
- ZIGZAG
- MESA
- Retracement
- Aroon
INDICATORS LIST
LIST OF TOPICS
PRINT THIS ARTICLE
by Koos van der Merwe
Sometimes the simplest of charts can offer a world of knowledge.
Position: Buy
Koos van der Merwe
Has been a technical analyst since 1969, and has worked as a futures and options trader with First Financial Futures in Johannesburg, South Africa.
PRINT THIS ARTICLE
MOVING AVERAGES
A Nasdaq Chart
06/10/03 10:48:25 AMby Koos van der Merwe
Sometimes the simplest of charts can offer a world of knowledge.
Position: Buy
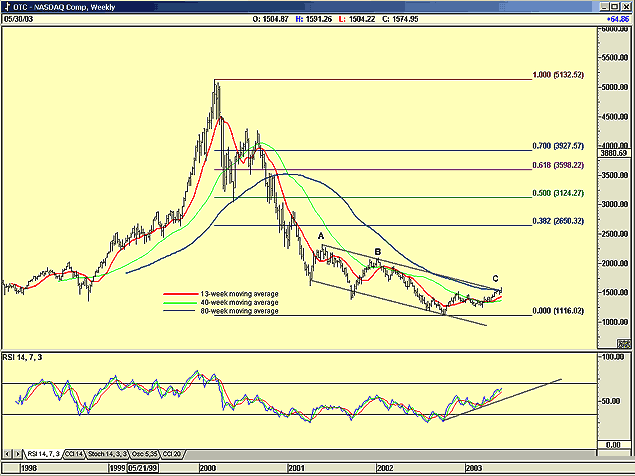
 Figure 1: The Nasdaq Index as it is now, and as it could be in the future. The chart above is a weekly chart of the Nasdaq index with three moving averages superimposed: |
| 1. A 13-week moving average (5 trading days x 13 weeks = 65 days). I have chosen this moving average because the index appeared to vacillate around it. Therefore it acts as a smoothing agent, one of the reasons it is highlighted in red on the chart. 2. A 40-week moving average shown in light green (5 x 40 = 200 days). The 200-day moving average is a standard, almost mystical moving average used to measure market trends. An index below the 200-day moving average is considered to be bearish. An index above the 200-day moving average is considered to be bullish. 3. An 80-week moving average shown in dark green (80 x 5 = 400 days). I have chosen this moving average as it is double the 200-day moving average. It also acted as a good support level in May 2000 and a resistance level in October of the same year. |

|
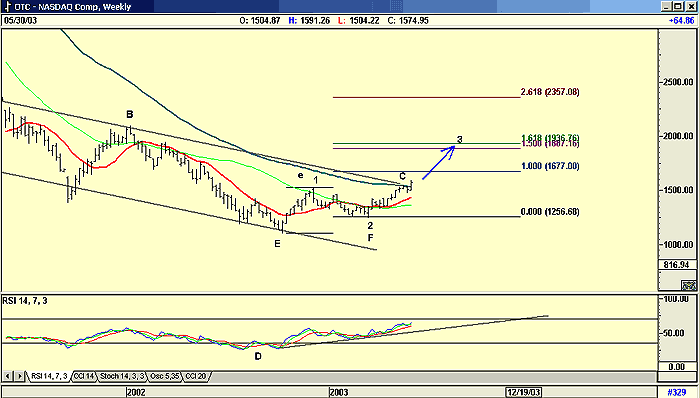
| Figure 2: Nasdaq weekly chart showing my Elliott wave count and Fibonacci levels. |
| Graphic provided by: AdvancedGET. |
| |
| Looking at the second chart, you can see the following: 1. The support and resistance lines drawn from the year 2001. Because the index is moving down, I will always draw the upper resistance line first, with a parallel as the support line. The resistance line connected the two tops at A and B projecting to C where the Nasdaq appears to be breaking out. The lower parallel line was taken from the resistance line. 2. The index broke above the 40-week moving average at F with the 13-week moving average. Although it did this and then failed at B, it is still a significant development. 3. At point C on the chart, the Index also appears to be breaking above the 80-week moving average, a sign of strength. 4. Finally, the 14-week RSI is moving up from an oversold level, from a divergence buy signal at D. Note the rising bottom at D compared to the chart's falling bottoms at E. This divergence is bullish. All the above suggests that the low of 116.02 at E is truly the low. Because of this I have determined the Fibonocci retracement levels of the fall from the high of 5132, in March 2000 to the low of 1116 in October 2002. These are levels the index could possibly test in the future. Or you can also take the distance between E and e and project a Fibonocci extension from the low at F. I have done this on the second chart. These are levels that the index could reach should it continue rising, with the upward movement as an Elliott impulse wave as shown on the chart. If the rise is truly an impulse wave, then wave 3, should you follow classic Elliott, will be at the 1.618 level at 1936. However, this would be magnificent should it occur. Should the rise top out and retrace at any level below 1677, the 1.00 Fibonacci level, then the count would be an ABC pattern. |
| Obviously, an Elliott count can be complicated, but sticking to the simple, let us be optimistic and expect the simple, namely a rise to 1936 for the top of wave 3 and a wave 5 topping out at the 2.618 level or at 2357. Should this not occur, be quick to change your view and your count. |
| The chart does look bullish, but nothing is cast in stone... yet. |
Has been a technical analyst since 1969, and has worked as a futures and options trader with First Financial Futures in Johannesburg, South Africa.
| Address: | 3256 West 24th Ave |
| Vancouver, BC | |
| Phone # for sales: | 6042634214 |
| E-mail address: | petroosp@gmail.com |
Click here for more information about our publications!
Comments
Date: 06/11/03Rank: 3Comment:
Date: 06/25/03Rank: 5Comment:

|

Request Information From Our Sponsors
- StockCharts.com, Inc.
- Candle Patterns
- Candlestick Charting Explained
- Intermarket Technical Analysis
- John Murphy on Chart Analysis
- John Murphy's Chart Pattern Recognition
- John Murphy's Market Message
- MurphyExplainsMarketAnalysis-Intermarket Analysis
- MurphyExplainsMarketAnalysis-Visual Analysis
- StockCharts.com
- Technical Analysis of the Financial Markets
- The Visual Investor
- VectorVest, Inc.
- Executive Premier Workshop
- One-Day Options Course
- OptionsPro
- Retirement Income Workshop
- Sure-Fire Trading Systems (VectorVest, Inc.)
- Trading as a Business Workshop
- VectorVest 7 EOD
- VectorVest 7 RealTime/IntraDay
- VectorVest AutoTester
- VectorVest Educational Services
- VectorVest OnLine
- VectorVest Options Analyzer
- VectorVest ProGraphics v6.0
- VectorVest ProTrader 7
- VectorVest RealTime Derby Tool
- VectorVest Simulator
- VectorVest Variator
- VectorVest Watchdog
