HOT TOPICS LIST
- MACD
- Fibonacci
- RSI
- Gann
- ADXR
- Stochastics
- Volume
- Triangles
- Futures
- Cycles
- Volatility
- ZIGZAG
- MESA
- Retracement
- Aroon
INDICATORS LIST
LIST OF TOPICS
PRINT THIS ARTICLE
by David Penn
After a 10-month bear market, orange juice futures are rallying from late spring lows.
Position: N/A
David Penn
Technical Writer for Technical Analysis of STOCKS & COMMODITIES magazine, Working-Money.com, and Traders.com Advantage.
PRINT THIS ARTICLE
REVERSAL
A Reversal in Juice?
06/10/03 09:06:53 AMby David Penn
After a 10-month bear market, orange juice futures are rallying from late spring lows.
Position: N/A
| July orange juice futures topped out at about 109.50 in early August 2002. July juice fell from this peak, making an intermediate-term, correction low at 99.50 in October. The futures rallied from this trough to make a test of the old high. This test, which peaked out in late November, saw July orange juice rise to as high as 107.20 before again retreating from higher prices. With the October lows broken in late December, the bear market in July orange juice had begun in earnest. |
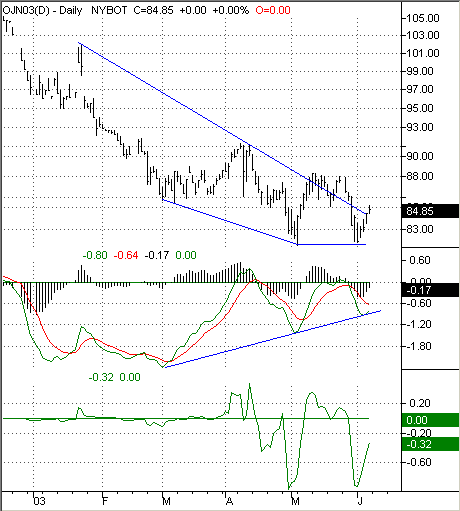
| Here, in early summer, there have been some signs that juice bulls might actually enjoy a rally in the near-term. July orange juice futures hit a low of 81.50 in early May, and then rallied to a high of 88 in the middle of the month, where it consolidated for a brief period of time before selling off relatively sharply toward the end of the month. Early in June, July juice retested the early May lows successfully as it dropped as low as 81.80 before moving up fairly sharply as June unfolded. |

|
| Rising MACD troughs and a sharp reversal in the Herrick Payoff Index suggest near-term higher prices for July orange juice. |
| Graphic provided by: TradeStation. |
| |
| There are technical indicators that point to the possibility of July orange juice continuing to move upward. The first compelling indicator is the moving average convergence/divergence (MACD), which features both trend-following and momentum characteristics--making it a popular and useful technical tool. Essentially, the MACD measures the difference between two exponential moving averages, typically the 12- and 26-day moving averages (both shown here). The MACD's movement can be interpreted based on crossovers (shorter moving average crossing the longer moving average), overbought/oversold conditions (when averages move particularly high or low in their range), or divergences (when the MACD is moving in a direction that is different from that of the price action of the tradable in question.) |
| Here, we have a case of the lattermost MACD attribute; namely, the positive divergence the MACD has shown vis-a-vis the price of July orange juice since the beginning of March. Note how July juice notched a low in March, and then a lower low in May. At the same time, the MACD indicator made a low in March, but then made a higher low in May. This was the first sign that July orange juice may be nearing a bottom of some duration. Further evidence of the positive divergence came when July orange juice tested its May low at the end of the month, yet the MACD indicator made still yet another high low. |
| The two May/June troughs are also suggestive of a double bottom--given the positive (bullish) divergence with the MACD and the rising action in the Herrick Payoff Index (HPI), a futures-only indicator that measures the volume flowing into or out of a futures contract (shown in green). A double bottom in July orange juice, if the pattern is found to be valid, would have to break out at 88, and would have near-term upside of about 94. However, the extent of the preceding bear market in orange juice should not be hastily dismissed. If July orange juice fails to move up here, then a test of the lows around 81--and perhaps even a break down to new lows--is something that cannot be ruled out. |
Technical Writer for Technical Analysis of STOCKS & COMMODITIES magazine, Working-Money.com, and Traders.com Advantage.
| Title: | Technical Writer |
| Company: | Technical Analysis, Inc. |
| Address: | 4757 California Avenue SW |
| Seattle, WA 98116 | |
| Phone # for sales: | 206 938 0570 |
| Fax: | 206 938 1307 |
| Website: | www.Traders.com |
| E-mail address: | DPenn@traders.com |
Traders' Resource Links | |
| Charting the Stock Market: The Wyckoff Method -- Books | |
| Working-Money.com -- Online Trading Services | |
| Traders.com Advantage -- Online Trading Services | |
| Technical Analysis of Stocks & Commodities -- Publications and Newsletters | |
| Working Money, at Working-Money.com -- Publications and Newsletters | |
| Traders.com Advantage -- Publications and Newsletters | |
| Professional Traders Starter Kit -- Software | |
Click here for more information about our publications!
PRINT THIS ARTICLE

Request Information From Our Sponsors
- StockCharts.com, Inc.
- Candle Patterns
- Candlestick Charting Explained
- Intermarket Technical Analysis
- John Murphy on Chart Analysis
- John Murphy's Chart Pattern Recognition
- John Murphy's Market Message
- MurphyExplainsMarketAnalysis-Intermarket Analysis
- MurphyExplainsMarketAnalysis-Visual Analysis
- StockCharts.com
- Technical Analysis of the Financial Markets
- The Visual Investor
- VectorVest, Inc.
- Executive Premier Workshop
- One-Day Options Course
- OptionsPro
- Retirement Income Workshop
- Sure-Fire Trading Systems (VectorVest, Inc.)
- Trading as a Business Workshop
- VectorVest 7 EOD
- VectorVest 7 RealTime/IntraDay
- VectorVest AutoTester
- VectorVest Educational Services
- VectorVest OnLine
- VectorVest Options Analyzer
- VectorVest ProGraphics v6.0
- VectorVest ProTrader 7
- VectorVest RealTime Derby Tool
- VectorVest Simulator
- VectorVest Variator
- VectorVest Watchdog
