HOT TOPICS LIST
- MACD
- Fibonacci
- RSI
- Gann
- ADXR
- Stochastics
- Volume
- Triangles
- Futures
- Cycles
- Volatility
- ZIGZAG
- MESA
- Retracement
- Aroon
INDICATORS LIST
LIST OF TOPICS
PRINT THIS ARTICLE
by Kevin Hopson
Nabors Industries' recent channel breakout indicates higher prices ahead. With the stock now pulling back to key support levels, it might be a good time to buy.
Position: Accumulate
Kevin Hopson
Kevin has been a technical analyst for roughly 10 years now. Previously, Kevin owned his own business and acted as a registered investment advisor, specializing in energy. He was also a freelance oil analyst for Orient Trading Co., a commodity futures trading firm in Japan. Kevin is currently a freelance writer.
PRINT THIS ARTICLE
TECHNICAL ANALYSIS
Nabors Industries' Channel Breakout
06/10/03 09:37:09 AMby Kevin Hopson
Nabors Industries' recent channel breakout indicates higher prices ahead. With the stock now pulling back to key support levels, it might be a good time to buy.
Position: Accumulate
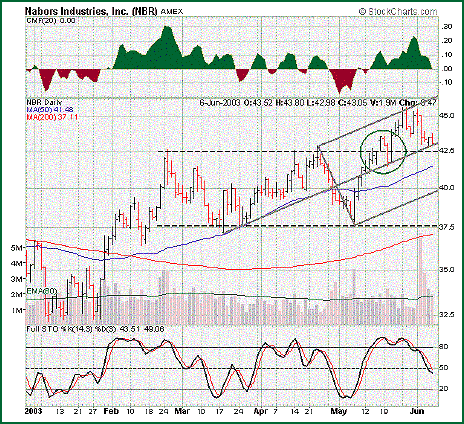
| Nabors Industries, Inc. (NBR) is an international drilling contractor specializing in the onshore drilling of oil, gas and geothermal wells. The company also provides land well services, as well as workover contracting services for both onshore and offshore wells. Technically speaking, the stock had been stuck in a three-month trading range up until last month. However, as you can see in the chart, Nabors recently broke out of this trading range, which indicates higher prices ahead. |
| More specifically, the channel breakout indicates an ultimate price target of between $52.00 and $56.00, which represents 20 to 30 percent of additional upside potential in the long-term. (For information on calculating price targets, see my article "Patterson's Channel Breakout Indicates Higher Prices in the Near-Term," posted to Traders.com Advantage, 02/03/03.) If you look at the chart, you will see that Nabors is now pulling back to key support levels, making the stock an attractive buy at current levels. For example, notice the green circle on the chart. This is where Nabors broke out if its trading range late last month. Since this channel line had previously acted as resistance, the stock should now find support along it, as those investors who sold at this level will be looking to get back in. |

|
| Graphic provided by: Stockcharts.com. |
| |
| Additionally, the median line of the gray pitchfork - which is currently supporting prices - has also come into play. Though not shown in the chart, the 38.2 percent retracement level from May's rally comes in around $42.67. As a result, Nabors should find significant support in the $42.50 to $43.00 range. Should prices proceed to pull back further, the $41.50 to $41.75 range - site of the stock's 50-day moving average and the 50 percent retracement level from May's rally - would likely be the ultimate downside target in the near-term. Being the case, I would look to accumulate shares of Nabors Industries on any short-term weakness. |
Kevin has been a technical analyst for roughly 10 years now. Previously, Kevin owned his own business and acted as a registered investment advisor, specializing in energy. He was also a freelance oil analyst for Orient Trading Co., a commodity futures trading firm in Japan. Kevin is currently a freelance writer.
| Glen Allen, VA | |
| E-mail address: | hopson_1@yahoo.com |
Click here for more information about our publications!
PRINT THIS ARTICLE

Request Information From Our Sponsors
- VectorVest, Inc.
- Executive Premier Workshop
- One-Day Options Course
- OptionsPro
- Retirement Income Workshop
- Sure-Fire Trading Systems (VectorVest, Inc.)
- Trading as a Business Workshop
- VectorVest 7 EOD
- VectorVest 7 RealTime/IntraDay
- VectorVest AutoTester
- VectorVest Educational Services
- VectorVest OnLine
- VectorVest Options Analyzer
- VectorVest ProGraphics v6.0
- VectorVest ProTrader 7
- VectorVest RealTime Derby Tool
- VectorVest Simulator
- VectorVest Variator
- VectorVest Watchdog
- StockCharts.com, Inc.
- Candle Patterns
- Candlestick Charting Explained
- Intermarket Technical Analysis
- John Murphy on Chart Analysis
- John Murphy's Chart Pattern Recognition
- John Murphy's Market Message
- MurphyExplainsMarketAnalysis-Intermarket Analysis
- MurphyExplainsMarketAnalysis-Visual Analysis
- StockCharts.com
- Technical Analysis of the Financial Markets
- The Visual Investor
