HOT TOPICS LIST
- MACD
- Fibonacci
- RSI
- Gann
- ADXR
- Stochastics
- Volume
- Triangles
- Futures
- Cycles
- Volatility
- ZIGZAG
- MESA
- Retracement
- Aroon
INDICATORS LIST
LIST OF TOPICS
PRINT THIS ARTICLE
by David Penn
Bears might not like it, but the bulls are taking the S&P 500 higher.
Position: N/A
David Penn
Technical Writer for Technical Analysis of STOCKS & COMMODITIES magazine, Working-Money.com, and Traders.com Advantage.
PRINT THIS ARTICLE
TRITOP/TRI BOTTOM
The S&P 500's MACD Triple Bottom Breakout
06/09/03 09:08:42 AMby David Penn
Bears might not like it, but the bulls are taking the S&P 500 higher.
Position: N/A
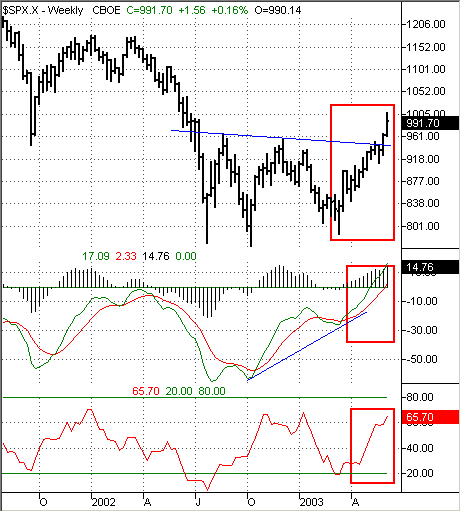
| As someone who has spent an unfortunate amount of time this spring pointing out negative divergences between the spring rally in stocks and indicators such as the relative strength index, I must admit that the obviousness of the way the moving average convergence/divergence indicator (MACD) and other indicators have led the market up is more than a little mortifying to witness. |
| Coupled with what now appears to be a bonafide breakout from a triple-bottom shaped consolidation range that began at the start of the third quarter of 2002, and there appears to be less and less support to the bearish (or even, perhaps, neutral) case against stocks. The triple bottom consists now of the July and October declines from 2002 and the March decline in 2003 and while there were a number of commentators whose timing was impeccable in buying the March lows (Jim Cramer and Bob Brinker come most immediately to mind), those who have waited for the market to clear the previous rally peaks before jumping on the bull market bandwagon are not necessarily worse off for their waiting. This is especially so if the market successfully tests its breakout point--about 945 on a declining neckline--and moves higher. |

|
| The higher MACD trough in the first quarter of 2003--relative to the lower MACD trough in the fourth quarter of 2002--was confirmation of the market's reversal to the upside. The move up has also been accompanied by increases in Money Flow. |
| Graphic provided by: TradeStation. |
| |
| The MACD indicator has begun to move up above the "zero line," which is another portent for higher prices. In fact, when compared to the performance of the MACD during the rallies following the July lows and the October lows, that the MACD is trending higher is further vindication of the triple bottom breakout. Money Flow has also been moving up powerfully since the March lows, providing "fuel" for the advance. |
| If the triple bottom formation turns out to be valid, then what sort of upside might be in store? Using Stan Weinstein's "swing rule," the distance from the lowest point in the formation to the highest point is approximately 196. When this amount is added to the value at the neckline/breakout point, we get an upside target of 1140. |
| For those who see this as too much of a gain after an already-powerful rally off the March lows, know that even a rally to 1140--which would have the S&P 500 up more than 44% from the March 2003 lows--would not take out the 2002 highs set in the spring (approximately 1180). These highs are the only real resistance to the S&P 500 right now--with a caveat for the possible resistance the trough low between the December 2001 and March 2002 highs at 1070 might provide. |
Technical Writer for Technical Analysis of STOCKS & COMMODITIES magazine, Working-Money.com, and Traders.com Advantage.
| Title: | Technical Writer |
| Company: | Technical Analysis, Inc. |
| Address: | 4757 California Avenue SW |
| Seattle, WA 98116 | |
| Phone # for sales: | 206 938 0570 |
| Fax: | 206 938 1307 |
| Website: | www.Traders.com |
| E-mail address: | DPenn@traders.com |
Traders' Resource Links | |
| Charting the Stock Market: The Wyckoff Method -- Books | |
| Working-Money.com -- Online Trading Services | |
| Traders.com Advantage -- Online Trading Services | |
| Technical Analysis of Stocks & Commodities -- Publications and Newsletters | |
| Working Money, at Working-Money.com -- Publications and Newsletters | |
| Traders.com Advantage -- Publications and Newsletters | |
| Professional Traders Starter Kit -- Software | |
Click here for more information about our publications!
Comments
Date: 06/09/03Rank: 4Comment:
Date: 06/14/03Rank: 3Comment:

|

Request Information From Our Sponsors
- StockCharts.com, Inc.
- Candle Patterns
- Candlestick Charting Explained
- Intermarket Technical Analysis
- John Murphy on Chart Analysis
- John Murphy's Chart Pattern Recognition
- John Murphy's Market Message
- MurphyExplainsMarketAnalysis-Intermarket Analysis
- MurphyExplainsMarketAnalysis-Visual Analysis
- StockCharts.com
- Technical Analysis of the Financial Markets
- The Visual Investor
- VectorVest, Inc.
- Executive Premier Workshop
- One-Day Options Course
- OptionsPro
- Retirement Income Workshop
- Sure-Fire Trading Systems (VectorVest, Inc.)
- Trading as a Business Workshop
- VectorVest 7 EOD
- VectorVest 7 RealTime/IntraDay
- VectorVest AutoTester
- VectorVest Educational Services
- VectorVest OnLine
- VectorVest Options Analyzer
- VectorVest ProGraphics v6.0
- VectorVest ProTrader 7
- VectorVest RealTime Derby Tool
- VectorVest Simulator
- VectorVest Variator
- VectorVest Watchdog
