HOT TOPICS LIST
- MACD
- Fibonacci
- RSI
- Gann
- ADXR
- Stochastics
- Volume
- Triangles
- Futures
- Cycles
- Volatility
- ZIGZAG
- MESA
- Retracement
- Aroon
INDICATORS LIST
LIST OF TOPICS
PRINT THIS ARTICLE
by Gary Grosschadl
The strength or weakness of the USD often impacts the equities markets. Everyone knows that the greenback has taken a beating- has it bottomed?
Position: N/A
Gary Grosschadl
Independent Canadian equities trader and technical analyst based in Peterborough
Ontario, Canada.
PRINT THIS ARTICLE
CURRENCY TRADING
US Dollar Index May Boost the Indices Higher
06/06/03 08:17:56 AMby Gary Grosschadl
The strength or weakness of the USD often impacts the equities markets. Everyone knows that the greenback has taken a beating- has it bottomed?
Position: N/A
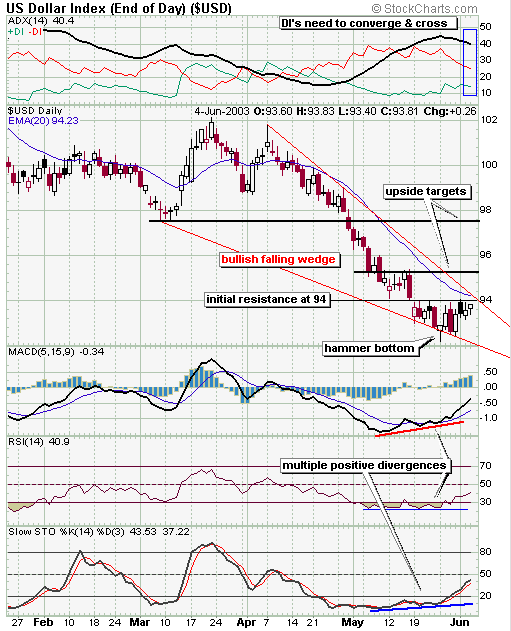
| This daily chart shows the shorter-term picture and a bottom could be in the making for the USD, at least for the immediate future. If correct then this could easily add fuel to the fire that's stoking the indices. |
| The chart shows a falling wedge pattern which is bullish, but to be realized as such it does need to break past the upper red trendline with conviction. At times the move can come back to test the same line before moving higher once again so this is a future consideration. |

|
| Daily chart of USD. |
| Graphic provided by: Stockcharts.com. |
| |
| Several indicators add weight to this potentially bullish scenario. The ADX line on the topmost graph has peaked and has started to decline. This shows that the previous trend downwards is weakening. If this accelerates, then the DI lines should converge and cross. The green +DI line represents bullish power while the red -DI represents bearish power. Whichever is on top controls the trend. If the +DI lines moves above then the bulls dominate the bears. The ADX line indicates the strength of the trend and ideally lies between both DIs, is upsloping, and above 20. The lower indicator graphs show positive divergences to price action which is bullish. As the USD moved lower, these indicators did not confirm with similar action. This often precedes a reversal attempt. Also note the bottom hammer marking the low of this chart. It took its time to confirm higher but I consider the hammer now confirmed. |
| The chart shows three resistance lines. The first one is fairly obvious at 94. The next two coincide with significant candle areas of previous congestion or previous support as marked. |
| Watch the action closely here as the impact on the main indices will likely be meaningful. |
Independent Canadian equities trader and technical analyst based in Peterborough
Ontario, Canada.
| Website: | www.whatsonsale.ca/financial.html |
| E-mail address: | gwg7@sympatico.ca |
Click here for more information about our publications!
Comments
Date: 06/09/03Rank: 4Comment:
Date: 06/10/03Rank: 3Comment:
Date: 06/10/03Rank: 5Comment:

Request Information From Our Sponsors
- StockCharts.com, Inc.
- Candle Patterns
- Candlestick Charting Explained
- Intermarket Technical Analysis
- John Murphy on Chart Analysis
- John Murphy's Chart Pattern Recognition
- John Murphy's Market Message
- MurphyExplainsMarketAnalysis-Intermarket Analysis
- MurphyExplainsMarketAnalysis-Visual Analysis
- StockCharts.com
- Technical Analysis of the Financial Markets
- The Visual Investor
- VectorVest, Inc.
- Executive Premier Workshop
- One-Day Options Course
- OptionsPro
- Retirement Income Workshop
- Sure-Fire Trading Systems (VectorVest, Inc.)
- Trading as a Business Workshop
- VectorVest 7 EOD
- VectorVest 7 RealTime/IntraDay
- VectorVest AutoTester
- VectorVest Educational Services
- VectorVest OnLine
- VectorVest Options Analyzer
- VectorVest ProGraphics v6.0
- VectorVest ProTrader 7
- VectorVest RealTime Derby Tool
- VectorVest Simulator
- VectorVest Variator
- VectorVest Watchdog
