HOT TOPICS LIST
- MACD
- Fibonacci
- RSI
- Gann
- ADXR
- Stochastics
- Volume
- Triangles
- Futures
- Cycles
- Volatility
- ZIGZAG
- MESA
- Retracement
- Aroon
INDICATORS LIST
LIST OF TOPICS
PRINT THIS ARTICLE
by David Penn
After breaking out from a seven-month consolidation, soybeans' higher days may be behind it.
Position: N/A
David Penn
Technical Writer for Technical Analysis of STOCKS & COMMODITIES magazine, Working-Money.com, and Traders.com Advantage.
PRINT THIS ARTICLE
HEAD & SHOULDERS
July Soybeans Head and Shoulders Top
06/05/03 08:05:55 AMby David Penn
After breaking out from a seven-month consolidation, soybeans' higher days may be behind it.
Position: N/A
| Back in February, I pointed out an ascending triangle in soybean futures which suggested that significantly higher prices were likely ("Ascending Triangle in Soybeans," Traders.com Advantage, February 27, 2003). This article anticipated a minimum move from 579 to over 630, basis continuous futures. I followed this piece up with another a few months later ("The Triangle Breakout in Beans," Traders.com Advantage, May 2, 2003) which noted the break from the ascending triangle and upped the "minimum move" target from 630 to 658. One particularly bullish projection from the second article, a projection based on Fibonacci numbers and Elliott wave counts posited an advance as high as 720. |
| It appears as if the second projection (the 658 call in May) might have been the most accurate one. Basis July, soybean futures notched an intraday high of exactly 658 on May 20th after a breakout that lasted about a month and a half. The futures have retreated fairly swiftly from this high, including a break of an up trendline two days after the contract high was made. Prices tested this trendline approximately five days afterward in what looks like a classic 1-2-3 trend reversal (see my Traders.com Advantage article "Corn Turns the Corner" from May 15, 2003 for more on the 1-2-3 reversal, or check out the source itself in Victor Sperandeo's excellent trading primer, Methods of a Wall Street Master). |

|
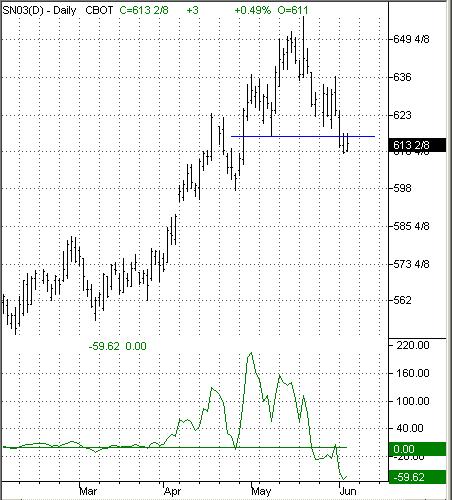
| A declining Herrick Payoff Index seems to support the possibility of a head and shoulders breakdown in July soybeans. |
| Graphic provided by: TradeStation. |
| |
| This price action seems to have led July soybeans into a month-long head and shoulders top, any breakdown from which could send soybean prices back into the seven-month long consolidation from whence they came. This head and shoulders pattern looks to be based on the rising price action at the end of April and beginning of May to establish a left shoulder, rising and falling price action from early May to late May to establish the "head," and swiftly rising and falling price action from the end of May into June to establish the right shoulder. Importantly, there does appear to be the requisite higher volume on the left side of the formation relative to the right side. To show this volume action, I have used John Herrick's Herrick Payoff Index (HPI) which specifically measures the amount of money flowing into and out of a futures contract. Note how the HPI soars near the end of April and actually moves into negative territory while the right shoulder is being formed in late May. |
| If this head and shoulders pattern turns out to be valid, then what sort of downside might be anticipated? Given a formation size of about 42 cents, and a breakdown point or neckline at 616, then a minimum drop of 574 could be reasonably expected. This would send soybeans back to the heart of its previous consolidation, which might help slow or stop altogether any descent to even lower soybean prices in the near-term. |
Technical Writer for Technical Analysis of STOCKS & COMMODITIES magazine, Working-Money.com, and Traders.com Advantage.
| Title: | Technical Writer |
| Company: | Technical Analysis, Inc. |
| Address: | 4757 California Avenue SW |
| Seattle, WA 98116 | |
| Phone # for sales: | 206 938 0570 |
| Fax: | 206 938 1307 |
| Website: | www.Traders.com |
| E-mail address: | DPenn@traders.com |
Traders' Resource Links | |
| Charting the Stock Market: The Wyckoff Method -- Books | |
| Working-Money.com -- Online Trading Services | |
| Traders.com Advantage -- Online Trading Services | |
| Technical Analysis of Stocks & Commodities -- Publications and Newsletters | |
| Working Money, at Working-Money.com -- Publications and Newsletters | |
| Traders.com Advantage -- Publications and Newsletters | |
| Professional Traders Starter Kit -- Software | |
Click here for more information about our publications!
PRINT THIS ARTICLE

Request Information From Our Sponsors
- StockCharts.com, Inc.
- Candle Patterns
- Candlestick Charting Explained
- Intermarket Technical Analysis
- John Murphy on Chart Analysis
- John Murphy's Chart Pattern Recognition
- John Murphy's Market Message
- MurphyExplainsMarketAnalysis-Intermarket Analysis
- MurphyExplainsMarketAnalysis-Visual Analysis
- StockCharts.com
- Technical Analysis of the Financial Markets
- The Visual Investor
- VectorVest, Inc.
- Executive Premier Workshop
- One-Day Options Course
- OptionsPro
- Retirement Income Workshop
- Sure-Fire Trading Systems (VectorVest, Inc.)
- Trading as a Business Workshop
- VectorVest 7 EOD
- VectorVest 7 RealTime/IntraDay
- VectorVest AutoTester
- VectorVest Educational Services
- VectorVest OnLine
- VectorVest Options Analyzer
- VectorVest ProGraphics v6.0
- VectorVest ProTrader 7
- VectorVest RealTime Derby Tool
- VectorVest Simulator
- VectorVest Variator
- VectorVest Watchdog
