HOT TOPICS LIST
- MACD
- Fibonacci
- RSI
- Gann
- ADXR
- Stochastics
- Volume
- Triangles
- Futures
- Cycles
- Volatility
- ZIGZAG
- MESA
- Retracement
- Aroon
INDICATORS LIST
LIST OF TOPICS
PRINT THIS ARTICLE
by Gary Grosschadl
Ameristar Casinos are having a run of bad luck and candlestick readers had ample warning before the crows flew south.
Position: Sell
Gary Grosschadl
Independent Canadian equities trader and technical analyst based in Peterborough
Ontario, Canada.
PRINT THIS ARTICLE
CHART ANALYSIS
Three Black Crows - Not A Winner
06/05/03 08:45:02 AMby Gary Grosschadl
Ameristar Casinos are having a run of bad luck and candlestick readers had ample warning before the crows flew south.
Position: Sell
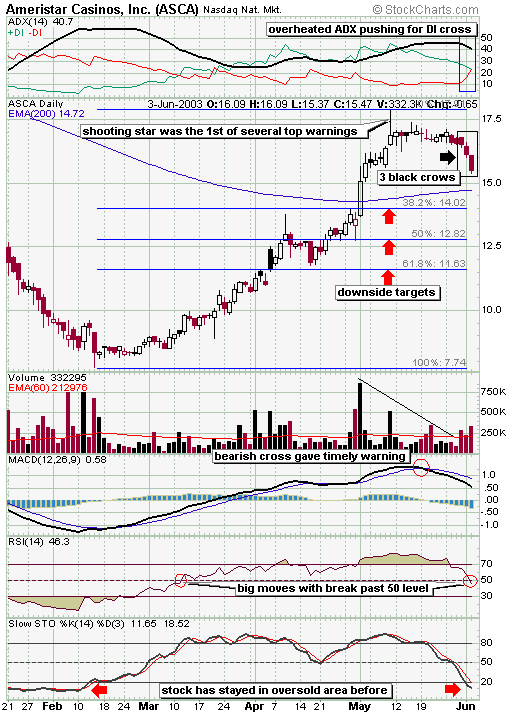
| After an extended rally, three black crows indicate a top reversal for Ameristar Casinos (ASCA). These relatively long consecutive candlesticks ideally close at or near their bottoms as is the case here. |
| But this bearish development did not come out of the blue-- There were other signals indicating a top was likely occurring. The first sign was a prominent shooting star candle with its distinctive long tail or upper shadow hinting that the highest price was not sustainable. When a shooting star is not negated by a move higher in the next few days it is often an excellent top warning. Aggressive traders will often take a short position the following day on a downward confirmation. In this case the stock meandered sideways for two weeks until the three black crows sealed this sour deal. The observant candlestick reader saw a series of other warning candles in those two weeks. Several hanging man candles (the name given to hammers occurring at toppy prices), another smaller shooting star and multiple doji candlesticks. Dojis at tops and bottoms indicate indecision or a temporary balance between bulls and bears and in doing so show a loss of previous momentum. |

|
| ASCA daily chart. |
| Graphic provided by: Stockcharts.com. |
| |
| Adding to all these candle signals, several indicators were also pointing to trouble ahead. At the top of the chart, ADX and DIs were in a bearish warning mode with ADX having peaked well above the DIs and the DIs were converging, showing bulls losing strength as the bearish strength was growing. All this was pointing to the probable end of the previous trend and a DI crossover was likely coming, shifting power to the bears. The volume trend was also bearish with a declining trend as prices were moving higher. The MACD or moving average convergence/divergence showed a bearish cross seven trading days before the three black crows struck. At the same time stochastics started coming down from overbought levels with a move below 80 very soon afterwards. |
| The question now remains - how much further can this decline carry? Stochastics have now come down to the oversold area so a bounce could ensue, but notice by previous example that it can stay in an oversold postion for a longer period. Now is a good time to note the RSI or relative strength indicator as it is moving through the 50 level. Often a move through this level is a significant development and back in March this was well borne out in the opposite direction. This leads me to believe that a nearby bounce if it occurs may be short-lived. This pause could occur at or near the 200-day EMA currently at 14.72, so this may be an area to watch if you are short the stock and nervous about holding longer. If that level does not hold, I have indicated possible downside targets at three Fibonacci retracement levels. Note how they correspond well to possible key candlestick points. Look for possible reversal points at or near any of those levels as a guide going forward. If the crows have a tailwind they may keep going south towards those lower targets. |
Independent Canadian equities trader and technical analyst based in Peterborough
Ontario, Canada.
| Website: | www.whatsonsale.ca/financial.html |
| E-mail address: | gwg7@sympatico.ca |
Click here for more information about our publications!
Comments
Date: 06/10/03Rank: 5Comment:

Request Information From Our Sponsors
- VectorVest, Inc.
- Executive Premier Workshop
- One-Day Options Course
- OptionsPro
- Retirement Income Workshop
- Sure-Fire Trading Systems (VectorVest, Inc.)
- Trading as a Business Workshop
- VectorVest 7 EOD
- VectorVest 7 RealTime/IntraDay
- VectorVest AutoTester
- VectorVest Educational Services
- VectorVest OnLine
- VectorVest Options Analyzer
- VectorVest ProGraphics v6.0
- VectorVest ProTrader 7
- VectorVest RealTime Derby Tool
- VectorVest Simulator
- VectorVest Variator
- VectorVest Watchdog
- StockCharts.com, Inc.
- Candle Patterns
- Candlestick Charting Explained
- Intermarket Technical Analysis
- John Murphy on Chart Analysis
- John Murphy's Chart Pattern Recognition
- John Murphy's Market Message
- MurphyExplainsMarketAnalysis-Intermarket Analysis
- MurphyExplainsMarketAnalysis-Visual Analysis
- StockCharts.com
- Technical Analysis of the Financial Markets
- The Visual Investor
