HOT TOPICS LIST
- MACD
- Fibonacci
- RSI
- Gann
- ADXR
- Stochastics
- Volume
- Triangles
- Futures
- Cycles
- Volatility
- ZIGZAG
- MESA
- Retracement
- Aroon
INDICATORS LIST
LIST OF TOPICS
PRINT THIS ARTICLE
by Koos van der Merwe
Here is an analysis of a difficult chart of a failing company.
Position: N/A
Koos van der Merwe
Has been a technical analyst since 1969, and has worked as a futures and options trader with First Financial Futures in Johannesburg, South Africa.
PRINT THIS ARTICLE
BROADENING FORMATION
Air Canada
06/06/03 09:24:29 AMby Koos van der Merwe
Here is an analysis of a difficult chart of a failing company.
Position: N/A
| ...and he forgot all his inhibitions when he discovered the freedom of flight, and he flew too close to the sun. The delicate beeswax with which his wings were held together melted, and Icarus fell from the sky.... Since 911, one airline after another in North America has suffered as the number of fliers took fright and fell. Air Canada in particular suffered more than most, with the SARS epidemic in Toronto adding fuel to the fire. The company is now in creditor protection. The question is, can Canada accept not having a national airline, or will they open their skies to all and sundry, and allow Air Canada to move into bankruptcy. Can studying a chart give us the answer? |
| Analyzing this chart is not easy, as the share price by all accounts should be worthless, yet it isn't. For this reason, I have attempted to analyze that chart using the Elliott Wave Theory. Do realize that under normal circumstances when a share is difficult to analyze it is best to leave it alone and look for something else. However, because of my curiosity as to whether the company will truly fall into bankruptcy, and also because I have a number of clients who own bonds of the company in the belief that the Canadian government will not allow the airline to go into bankruptcy, the exercise is an interesting undertaking. |

|
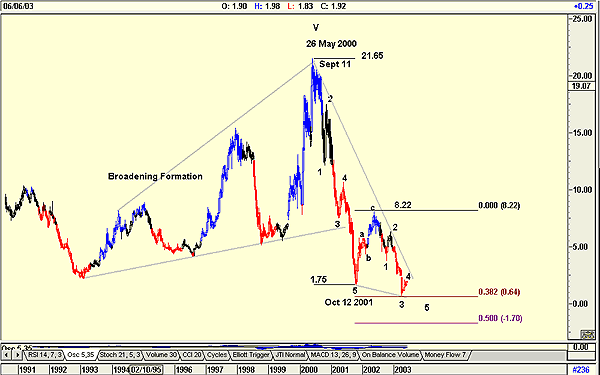
| Figure 1: Air Canada showing broadening formation and Elliott count. |
| Graphic provided by: AdvancedGET. |
| |
| The chart above is a weekly chart showing a broadening formation that began in 1992. This in itself is a warning of the uncertainty that could be expected in evaluating the company technically. On May 26, 2000, the share price reached a high of $21.65, and with the September 11th terrorist attack, fell dramatically in 5 waves as shown on the chart to a low of $1.75 on October 12, 2001. It then attempted to rally, but could not rise above $8.22, falling once more to a low of $0.64 in March of this year. This fall is 38.2% of the previous 5 wave fall. |
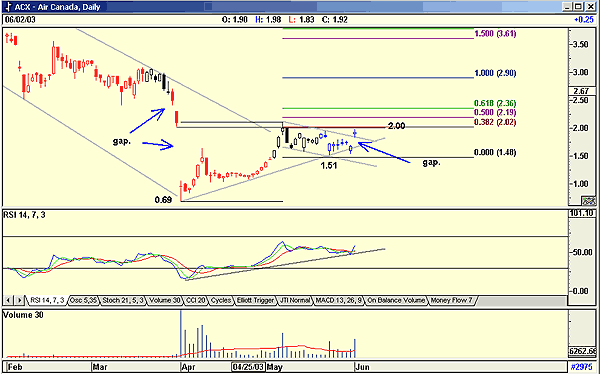
 Figure 2: Daily chart of Air Canada. Turning to the daily chart notice how the share price started to collapse four days before the company requested creditor protection. It fell to $0.69 before it started rising, probably on short covering to fill the gap, and tested the resistance level at $2.00. From here it appears to have formed a flag and broken out of the pattern upwards as Air Canada came to agreements with labour finding $1.1 billion in savings. The company still has to negotiate new deals with lessors, lenders, bond holders and suppliers in an attempt to reduce its debt of $13 billion. The rising RSI suggests that this is indeed possible, and that sometime in the future the price could break above the $2.00 resistance level. Volume on a rising price is presently above average, a further sign of strength. Finally a Fibonocci extension taken from the low of 0.69 to the high of $2.00 and projected from the low of $1.51 suggests a 38.2% target of $2.02, a 50% target of $2.19, etc. (see chart). |
| To conclude, with Canada being more of a socialistic country than the United States, will the government accept free enterprise or subsidize a national airline? On the plus side, they may want to bail out the airline in order to preserve national pride, and to prevent the tremendous unemployment resulting from the dissolution of the airline and the subsequent tax loss to the government. On the other hand, they would be forced to subsidize an airline at a loss to outlying areas. Charts are telling us that at the moment there is hope, with more than a good chance that the airline will survive. Vive Air Canada. |
Has been a technical analyst since 1969, and has worked as a futures and options trader with First Financial Futures in Johannesburg, South Africa.
| Address: | 3256 West 24th Ave |
| Vancouver, BC | |
| Phone # for sales: | 6042634214 |
| E-mail address: | petroosp@gmail.com |
Click here for more information about our publications!
PRINT THIS ARTICLE

Request Information From Our Sponsors
- StockCharts.com, Inc.
- Candle Patterns
- Candlestick Charting Explained
- Intermarket Technical Analysis
- John Murphy on Chart Analysis
- John Murphy's Chart Pattern Recognition
- John Murphy's Market Message
- MurphyExplainsMarketAnalysis-Intermarket Analysis
- MurphyExplainsMarketAnalysis-Visual Analysis
- StockCharts.com
- Technical Analysis of the Financial Markets
- The Visual Investor
- VectorVest, Inc.
- Executive Premier Workshop
- One-Day Options Course
- OptionsPro
- Retirement Income Workshop
- Sure-Fire Trading Systems (VectorVest, Inc.)
- Trading as a Business Workshop
- VectorVest 7 EOD
- VectorVest 7 RealTime/IntraDay
- VectorVest AutoTester
- VectorVest Educational Services
- VectorVest OnLine
- VectorVest Options Analyzer
- VectorVest ProGraphics v6.0
- VectorVest ProTrader 7
- VectorVest RealTime Derby Tool
- VectorVest Simulator
- VectorVest Variator
- VectorVest Watchdog
