HOT TOPICS LIST
- MACD
- Fibonacci
- RSI
- Gann
- ADXR
- Stochastics
- Volume
- Triangles
- Futures
- Cycles
- Volatility
- ZIGZAG
- MESA
- Retracement
- Aroon
INDICATORS LIST
LIST OF TOPICS
PRINT THIS ARTICLE
by David Penn
The only thing more amazing about the Nasdaq's rally since March is that it hasn't featured more than four consecutive up days.
Position: N/A
David Penn
Technical Writer for Technical Analysis of STOCKS & COMMODITIES magazine, Working-Money.com, and Traders.com Advantage.
PRINT THIS ARTICLE
REVERSAL
The Nasdaq and the Four Day Corollary
06/05/03 09:47:33 AMby David Penn
The only thing more amazing about the Nasdaq's rally since March is that it hasn't featured more than four consecutive up days.
Position: N/A
| Not having more than four consecutive up days in a market advance spanning a few months or more is not necessarily a rarity. Actually, those who thought there was no reason for stocks to be rallying as powerfully and thoroughly (i.e., in volume and breadth) should know that the absence of too many consecutive up days is actually a sign of strength in an advancing market. A down day every few sessions in the course of market advance tends to reflect broader participation in the rally (more good opportunities for entries and exits), as well as tamping down the sort of groupthink optimism that bull markets inherently (if eventually) engender. |
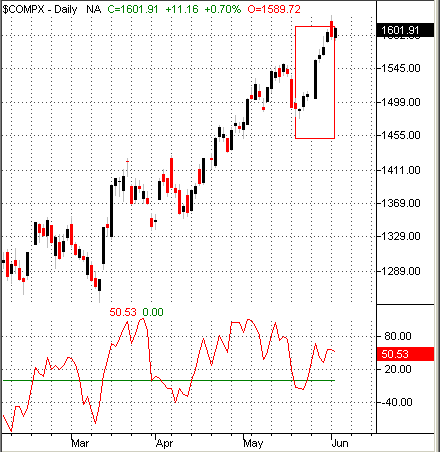
| The March 2003 rally in the Nasdaq, which saw the average climb more than 29% from mid-March to early June, may be a poor example of any "tamping down" of optimism. But it may be an excellent example of what can happen when a market that has been in an uptrend for an extended period of time, experiences a similarly extended series of consecutive up days--and then has a down day. |

|
| Does the reversal day following a series of consecutive up days late in the advance anticipate an actual reversal in trend? |
| Graphic provided by: TradeStation. |
| |
| What I'm thinking about is a pattern recognition tool presented by Victor Sperandeo in his excellent book, Trader Vic--Principles of Professional Speculation. Sperandeo refers to it as the "Four Day Corollary" and this corollary suggests that whenever a market in a mature trend (he admits that this much of the corollary is relatively subjective) has four or more consecutive days in the direction of the trend, the first day that is against the trend tend to anticipate a loss of momentum and a possible reversal of trend. Like many of Sperandeo's pattern-based set-ups, the Four Day Corollary is oriented around spotting and seizing advantage of reversals and, thus, strict money and trade management are required. But also like many of Sperandeo's set-ups, the possibility of catching a market at its peak or bottom makes the Four Day Corollary--at a minimum--another effective analytic tool that technicians can add to their arsenal. |
| In the case of the Nasdaq in early June, there is the first (and only) instance of more than four consecutive pro-trend days. In fact, there are seven consecutive up days leading to the reversal day on June 2nd. The Four Day Corollary here would suggest selling on the reversal day (or, alternately, beneath the low of the reversal day), with a buy stop just above the high of the rally--which, in this case, is the high of the reversal day. |
Technical Writer for Technical Analysis of STOCKS & COMMODITIES magazine, Working-Money.com, and Traders.com Advantage.
| Title: | Technical Writer |
| Company: | Technical Analysis, Inc. |
| Address: | 4757 California Avenue SW |
| Seattle, WA 98116 | |
| Phone # for sales: | 206 938 0570 |
| Fax: | 206 938 1307 |
| Website: | www.Traders.com |
| E-mail address: | DPenn@traders.com |
Traders' Resource Links | |
| Charting the Stock Market: The Wyckoff Method -- Books | |
| Working-Money.com -- Online Trading Services | |
| Traders.com Advantage -- Online Trading Services | |
| Technical Analysis of Stocks & Commodities -- Publications and Newsletters | |
| Working Money, at Working-Money.com -- Publications and Newsletters | |
| Traders.com Advantage -- Publications and Newsletters | |
| Professional Traders Starter Kit -- Software | |
Click here for more information about our publications!
Comments
Date: 06/05/03Rank: 4Comment:
Date: 06/10/03Rank: 5Comment:
Date: 06/24/03Rank: 5Comment:

Request Information From Our Sponsors
- VectorVest, Inc.
- Executive Premier Workshop
- One-Day Options Course
- OptionsPro
- Retirement Income Workshop
- Sure-Fire Trading Systems (VectorVest, Inc.)
- Trading as a Business Workshop
- VectorVest 7 EOD
- VectorVest 7 RealTime/IntraDay
- VectorVest AutoTester
- VectorVest Educational Services
- VectorVest OnLine
- VectorVest Options Analyzer
- VectorVest ProGraphics v6.0
- VectorVest ProTrader 7
- VectorVest RealTime Derby Tool
- VectorVest Simulator
- VectorVest Variator
- VectorVest Watchdog
- StockCharts.com, Inc.
- Candle Patterns
- Candlestick Charting Explained
- Intermarket Technical Analysis
- John Murphy on Chart Analysis
- John Murphy's Chart Pattern Recognition
- John Murphy's Market Message
- MurphyExplainsMarketAnalysis-Intermarket Analysis
- MurphyExplainsMarketAnalysis-Visual Analysis
- StockCharts.com
- Technical Analysis of the Financial Markets
- The Visual Investor
