HOT TOPICS LIST
- MACD
- Fibonacci
- RSI
- Gann
- ADXR
- Stochastics
- Volume
- Triangles
- Futures
- Cycles
- Volatility
- ZIGZAG
- MESA
- Retracement
- Aroon
INDICATORS LIST
LIST OF TOPICS
PRINT THIS ARTICLE
by Arthur Hill
Troops charge ahead, but the generals stay behind as OEX lags the broader indices.
Position: N/A
Arthur Hill
Arthur Hill is currently editor of TDTrader.com, a website specializing in trading strategies, sector/industry specific breadth stats and overall technical analysis. He passed the Society of Technical Analysts (STA London) diploma exam with distinction is a Certified Financial Technician (CFTe). Prior to TD Trader, he was the Chief Technical Analyst for Stockcharts.com and the main contributor to the ChartSchool.
PRINT THIS ARTICLE
CHART ANALYSIS
Large Caps Laggeth
06/03/03 11:24:41 AMby Arthur Hill
Troops charge ahead, but the generals stay behind as OEX lags the broader indices.
Position: N/A
| The S&P 100 (OEX) represents 100 large-cap stocks that include General Electric, Microsoft, Wal-mart, Pfizer, Intel, IBM, Merck and Citigroup to name a few. The S&P 500 (SPX) is a large-cap dominated index that has expanded the S&P 100 list to 500 stocks. But the S&P 100 still represents the largest of the large. In contrast, the S&P 600 (SML) represents small-cap stocks and the S&P 400 (MID) represents mid-cap stocks. In military terms one could say that the S&P 500 and S&P 100 are the generals, while the S&P 400 Midcap Index and S&P 600 SmallCap Index are the troops. As in any war, one should watch the generals for true clues on future direction. |
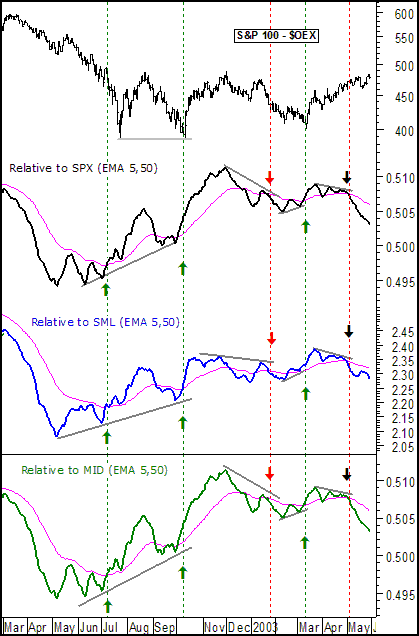
| One method of comparison is with the price relative, which is simply one index divided by the other and plotted over time (OEX/SPX). The chart below compares the performance of the S&P 100 to that of the S&P 500, S&P 400 Midcap and S&P 600 SmallCap Indices. Large-caps (OEX) are outperforming when the price relative advances and underperforming when the price relative declines. The price relative has been plotted as a 5-day EMA to smooth the data and a 50-day EMA was added to help identify the trend. |

|
| Figure 1: S&P 100 Index (OEX) relative to SPX, SML and MID. |
| Graphic provided by: MetaStock. |
| |
| Over the past year, large-cap performance has deviated close to important reversal points. Large-cap outperformance preceded the July, October and March lows (green arrows), while large-cap underperformance preceded the January high (red arrow). Bullish divergences formed in July, October and March as the price relatives formed higher lows and OEX formed equal or lower lows. Although a bearish divergence didn't form in January, it was clear that large-caps were much weaker than small and mid-caps. |
| Currently, a bearish divergence has formed over the last few weeks. The price relatives all formed lower highs and moved below their 50-day EMAs (black arrows), but the S&P 100 continues to record higher highs. Large-caps are underperforming and it is as if the troops are charging into battle, but the generals show reluctance. This is not a good sign and lack of large-cap leadership may come back to haunt the market. |
Arthur Hill is currently editor of TDTrader.com, a website specializing in trading strategies, sector/industry specific breadth stats and overall technical analysis. He passed the Society of Technical Analysts (STA London) diploma exam with distinction is a Certified Financial Technician (CFTe). Prior to TD Trader, he was the Chief Technical Analyst for Stockcharts.com and the main contributor to the ChartSchool.
| Title: | Editor |
| Company: | TDTrader.com |
| Address: | Willem Geetsstraat 17 |
| Mechelen, B2800 | |
| Phone # for sales: | 3215345465 |
| Website: | www.tdtrader.com |
| E-mail address: | arthurh@tdtrader.com |
Traders' Resource Links | |
| TDTrader.com has not added any product or service information to TRADERS' RESOURCE. | |
Click here for more information about our publications!
PRINT THIS ARTICLE

Request Information From Our Sponsors
- VectorVest, Inc.
- Executive Premier Workshop
- One-Day Options Course
- OptionsPro
- Retirement Income Workshop
- Sure-Fire Trading Systems (VectorVest, Inc.)
- Trading as a Business Workshop
- VectorVest 7 EOD
- VectorVest 7 RealTime/IntraDay
- VectorVest AutoTester
- VectorVest Educational Services
- VectorVest OnLine
- VectorVest Options Analyzer
- VectorVest ProGraphics v6.0
- VectorVest ProTrader 7
- VectorVest RealTime Derby Tool
- VectorVest Simulator
- VectorVest Variator
- VectorVest Watchdog
- StockCharts.com, Inc.
- Candle Patterns
- Candlestick Charting Explained
- Intermarket Technical Analysis
- John Murphy on Chart Analysis
- John Murphy's Chart Pattern Recognition
- John Murphy's Market Message
- MurphyExplainsMarketAnalysis-Intermarket Analysis
- MurphyExplainsMarketAnalysis-Visual Analysis
- StockCharts.com
- Technical Analysis of the Financial Markets
- The Visual Investor
