HOT TOPICS LIST
- MACD
- Fibonacci
- RSI
- Gann
- ADXR
- Stochastics
- Volume
- Triangles
- Futures
- Cycles
- Volatility
- ZIGZAG
- MESA
- Retracement
- Aroon
INDICATORS LIST
LIST OF TOPICS
PRINT THIS ARTICLE
by Matt Blackman
The market has been ignoring bad news and celebrating the good. But how long can the good times last without a hangover?
Position: N/A
Matt Blackman
Matt Blackman is a full-time technical and financial writer and trader. He produces corporate and financial newsletters, and assists clients in getting published in the mainstream media. He is the host of TradeSystemGuru.com. Matt has earned the Chartered Market Technician (CMT) designation. Find out what stocks and futures Matt is watching on Twitter at www.twitter.com/RatioTrade
PRINT THIS ARTICLE
DIVERGENCE INDEX
Market Showing Strong Divergence
06/02/03 10:53:11 AMby Matt Blackman
The market has been ignoring bad news and celebrating the good. But how long can the good times last without a hangover?
Position: N/A
| Since March 11, the market has been on a tear. Driven by encouraging corporate earnings reports and some good economic data, the bulls have come out of hiding with a vengeance wearing their party hats. Momentum indicators such as the commodity channel index (CCI) and stochastics are glued into overbought territory on the weekly charts of the S&P 500 and the Standard & Poor's Deposits/Receipts (SPY). But amid the popping corks and clinking glasses, there are growing signs that the good times may be coming to an end, at least temporarily. |
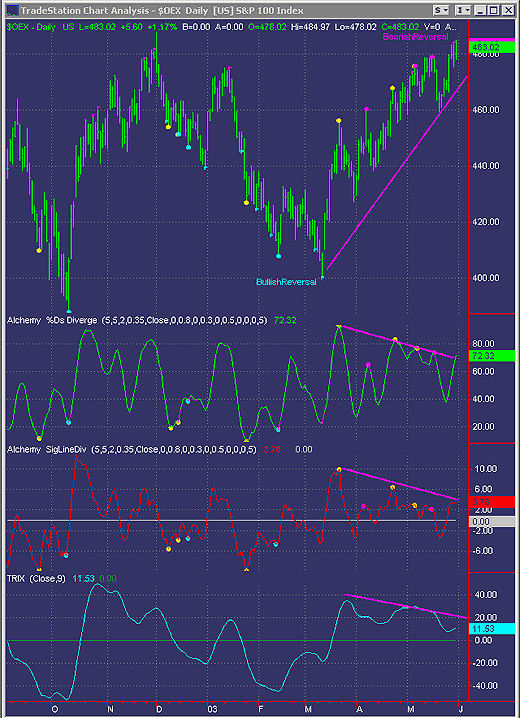
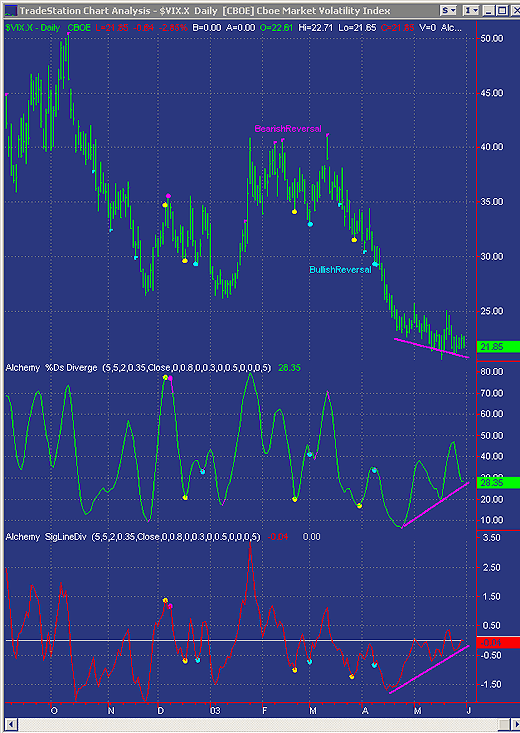
As a contrarian indicator, the VIX signals that the market is getting ready to correct with values in the mid to low 20s. Values approaching 50 have historically signaled market bottoms. As Figure 1 shows, both the OEX and VIX portend a change in direction. |

|
| Figure 1 – Daily charts of S&P100 (OEX) and CBOT Market Volatility Index (VIX) both showing strong bearish divergence with the %D divergence and signal line divergence indicators. Indicators by TradingAlchemy.com |
| Graphic provided by: TradeStation. |
| |
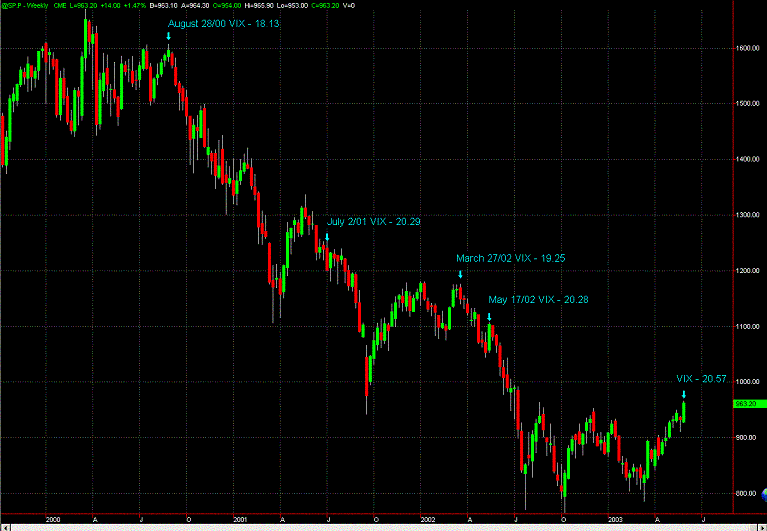
| The weakness with divergences is that because signals are based on momentum indicators (which can remain overbought in uptrends and oversold in downtrends), it is imperative that they be confirmed by trend analysis. This means that a sell signal should not be acted upon until the trendline is significantly broken. It is also interesting to note that we have hit the critical 965 level on the S&P 500 index (Figure 2), which is the neckline of the long-term head & shoulders top pattern (see The Critical Head & Shoulders Test - Working Money, 11/12/02). Technicians will be watching the market closely for signs that the resistance level will hold or break.  Figure 2: Weekly chart of the S&P Another red flag is the number of insiders selling versus buying, especially in the tech sector. According to the Wall Street Journal, most recent insider share transaction figures (week ending May 13) show that insiders sold 815.8 million shares to 27.8 purchased for the week. Insiders also announced plans to sell another 867 million shares in SEC filings. Including both current and planned sales, that's a ratio of more than 60 to 1. Do the insiders know something we don't? Suggested Reading: Blackman, Matt [2002] The Critical Head & Shoulders Test, Working Money: November |
Matt Blackman is a full-time technical and financial writer and trader. He produces corporate and financial newsletters, and assists clients in getting published in the mainstream media. He is the host of TradeSystemGuru.com. Matt has earned the Chartered Market Technician (CMT) designation. Find out what stocks and futures Matt is watching on Twitter at www.twitter.com/RatioTrade
| Company: | TradeSystemGuru.com |
| Address: | Box 2589 |
| Garibaldi Highlands, BC Canada | |
| Phone # for sales: | 604-898-9069 |
| Fax: | 604-898-9069 |
| Website: | www.tradesystemguru.com |
| E-mail address: | indextradermb@gmail.com |
Traders' Resource Links | |
| TradeSystemGuru.com has not added any product or service information to TRADERS' RESOURCE. | |
Click here for more information about our publications!
Comments
Date: 06/02/03Rank: 5Comment:
Date: 06/03/03Rank: 5Comment: Yes, this Article, and so many others, are great ( comforting to see technicals that I hadn t checked out, backing up my own thoughts.)
Pointer, thought: Could you please get your authors to NOT submit Charts with background colors (black!) These look pretty, but printing the article sure takes a heck of a lot of ink--and those ink cartridges are never reeuced in a sale!
Thanks,
B. H. Peterson
Date: 06/04/03Rank: 4Comment:

|

Request Information From Our Sponsors
- StockCharts.com, Inc.
- Candle Patterns
- Candlestick Charting Explained
- Intermarket Technical Analysis
- John Murphy on Chart Analysis
- John Murphy's Chart Pattern Recognition
- John Murphy's Market Message
- MurphyExplainsMarketAnalysis-Intermarket Analysis
- MurphyExplainsMarketAnalysis-Visual Analysis
- StockCharts.com
- Technical Analysis of the Financial Markets
- The Visual Investor
- VectorVest, Inc.
- Executive Premier Workshop
- One-Day Options Course
- OptionsPro
- Retirement Income Workshop
- Sure-Fire Trading Systems (VectorVest, Inc.)
- Trading as a Business Workshop
- VectorVest 7 EOD
- VectorVest 7 RealTime/IntraDay
- VectorVest AutoTester
- VectorVest Educational Services
- VectorVest OnLine
- VectorVest Options Analyzer
- VectorVest ProGraphics v6.0
- VectorVest ProTrader 7
- VectorVest RealTime Derby Tool
- VectorVest Simulator
- VectorVest Variator
- VectorVest Watchdog
