HOT TOPICS LIST
- MACD
- Fibonacci
- RSI
- Gann
- ADXR
- Stochastics
- Volume
- Triangles
- Futures
- Cycles
- Volatility
- ZIGZAG
- MESA
- Retracement
- Aroon
INDICATORS LIST
LIST OF TOPICS
PRINT THIS ARTICLE
by Gary Grosschadl
The TSX Gold Index is giving clues to gold traders via its trend channel and 200-day exponential moving average.
Position: N/A
Gary Grosschadl
Independent Canadian equities trader and technical analyst based in Peterborough
Ontario, Canada.
PRINT THIS ARTICLE
CHANNEL LINES
The Canadian Gold Index Gives Clear Clues
05/30/03 11:18:11 AMby Gary Grosschadl
The TSX Gold Index is giving clues to gold traders via its trend channel and 200-day exponential moving average.
Position: N/A
| This index composed of 11 Canadian golds follows the other gold indices, XAU and HUI, fairly well. The four biggest by size and relative weight (from 23 to 12%) are Barrick Gold, Placer Dome, Kinross Gold and Gold Corp. |
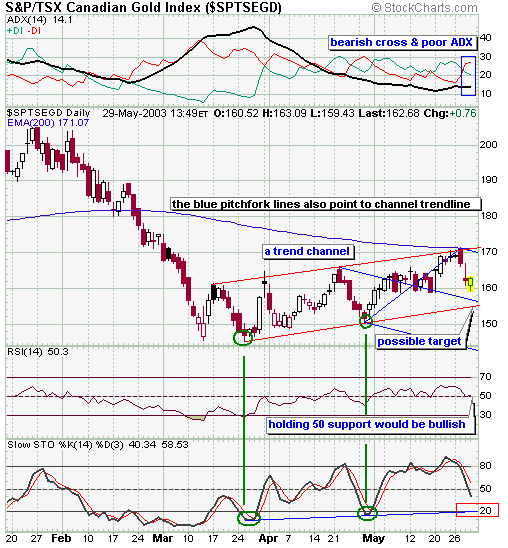
| During this latest upleg in gold stocks, the XAU and HUI indices were a challenge to read. How far will their current run go in the short term? By contrast the Canadian gold index seems to have a roadmap in place. The TSX Gold Index shows a clear trend channel and also the 200-period EMA line is in a prominent position to offer stiff resistance, being right at the trendline at 171. When stocks or indices come to their first 200-period EMA challenge in a while, they often balk and retreat, sometimes several times. This pattern was well illustrated by the Nasdaq the past several months. Since December the Nasdaq failed four times at the 200-day EMA before finally rising above it. |

|
| Daily chart for TSX Gold Index. |
| Graphic provided by: Stockcharts.com. |
| |
| Failure at the top trendline was aptly shown by a strong candle pattern - a bearish engulfing candle which was similar to the previous trendline failure after April 21. Other indicator clues were a bearish DI cross shown on top of the chart and a stochastic downturn from the 80 level as shown by the lowest indicator below the chart. |
| Now if the pattern repeats via a bounce off the lower trendline, a lower target could soon be in reach. The weak ADX and stochastic turns give weight to this notion. The weak ADX shows poor directional strength and so stochastic turns are more likely to occur in a more predictable range. Note how the last two stochastic upturns ocurred at the lower trendline touches. Blue pitchfork lines were drawn based on the last three pivot points and a move to the median line is also very close to the lower trendline. |
| In summary, a bounce at or near the lower trendline may bring another trading opportunity for gold bulls with a likely move back up to the upper channel. A failure to hold support at that same line could be a very bearish development, so wait for a good signal before commiting either way. This analysis shows the benefits of looking at several gold indices for clues to directional change as sometimes one tips its hand more clearly than the others. |
Independent Canadian equities trader and technical analyst based in Peterborough
Ontario, Canada.
| Website: | www.whatsonsale.ca/financial.html |
| E-mail address: | gwg7@sympatico.ca |
Click here for more information about our publications!
PRINT THIS ARTICLE

|

Request Information From Our Sponsors
- StockCharts.com, Inc.
- Candle Patterns
- Candlestick Charting Explained
- Intermarket Technical Analysis
- John Murphy on Chart Analysis
- John Murphy's Chart Pattern Recognition
- John Murphy's Market Message
- MurphyExplainsMarketAnalysis-Intermarket Analysis
- MurphyExplainsMarketAnalysis-Visual Analysis
- StockCharts.com
- Technical Analysis of the Financial Markets
- The Visual Investor
- VectorVest, Inc.
- Executive Premier Workshop
- One-Day Options Course
- OptionsPro
- Retirement Income Workshop
- Sure-Fire Trading Systems (VectorVest, Inc.)
- Trading as a Business Workshop
- VectorVest 7 EOD
- VectorVest 7 RealTime/IntraDay
- VectorVest AutoTester
- VectorVest Educational Services
- VectorVest OnLine
- VectorVest Options Analyzer
- VectorVest ProGraphics v6.0
- VectorVest ProTrader 7
- VectorVest RealTime Derby Tool
- VectorVest Simulator
- VectorVest Variator
- VectorVest Watchdog
