HOT TOPICS LIST
- MACD
- Fibonacci
- RSI
- Gann
- ADXR
- Stochastics
- Volume
- Triangles
- Futures
- Cycles
- Volatility
- ZIGZAG
- MESA
- Retracement
- Aroon
INDICATORS LIST
LIST OF TOPICS
PRINT THIS ARTICLE
by David Penn
The Herrick Payoff Index points to bearish divergences in crude oil futures. Is a reversal in the making?
Position: N/A
David Penn
Technical Writer for Technical Analysis of STOCKS & COMMODITIES magazine, Working-Money.com, and Traders.com Advantage.
PRINT THIS ARTICLE
HERRICK PAYOFF INDEX
Will Energy Plays Pay Off?
05/30/03 10:31:34 AMby David Penn
The Herrick Payoff Index points to bearish divergences in crude oil futures. Is a reversal in the making?
Position: N/A
| The Herrick Payoff Index is a relatively seldom-used technical indicator devised by John Herrick that provides information that is both straightforward and highly useful, namely, how much money is moving into or out of a given futures contract. Measuring based on open interest, the Herrick Payoff Index or HPI can only be used on futures contracts that feature open interest (no stocks or mutual funds). But for those who trade, analyze or monitor futures, the HPI can be a valuable tool--particularly with regard to spotting divergences between price action and the indicator. |
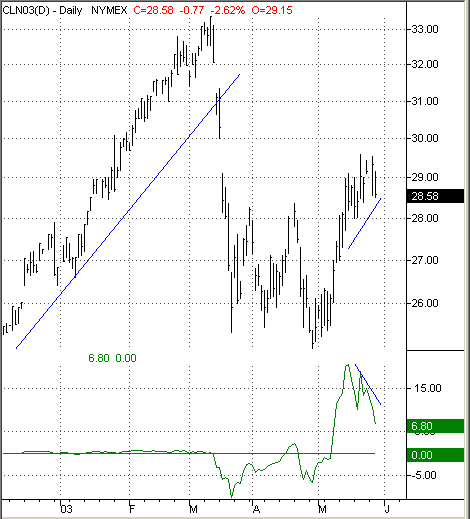
| As Steven Achelis points out in his book, Technical Analysis from A to Z, those using the HPI tend to watch for crosses above zero line (bullish insofar as money is flowing into the contract) or below it (bearish insofar as money is flowing out of the contract). Looking at the chart of the June crude oil contract below, note how a relatively flat HPI falls beneath the zero line in March, just as June crude is breaking down severely. Similarly, note how the HPI moved up above the zero line strongly in early May, shortly after June crude established a short-term bottom. |

|
| A falling HPI combined with rising prices suggests a bearish reversal in the making. |
| Graphic provided by: TradeStation. |
| |
| Looking at the most recent price action in crude, one could make an argument for both the bullish and bearish cases. On the bullish side, for example, the trio of lows from mid-March to late April is certainly suggestive of a bottom. And even if prices have slipped somewhat in the last week of May, price remain above the resistance-turned-support left over from the highest inter-trough peak (the April highs). Those inclined to include fundamentally-oriented analysis may point to continued concerns about the flow of oil from the Middle East, threats by OPEC to reduce production and keep oil prices "steady," increased demand from a modernizing China ... |
| However, there is a bearish case to be made as well and the Herrick Payoff Index is a strong contributor to it. Note how the HPI appears to peak around the middle of May, while prices in the June crude oil contract continue to climb. In fact, in the same way that a rising trendline can be drawn beneath the rising prices of June crude oil, a falling trendline can be drawn above the falling levels of the HPI. This is a classic negative divergence--no different from negative divergences found with other indicators such as the relative strength index or the moving average convergence/divergence indicator. Here, the divergence is suggesting that money is flowing out of June crude at the same time that crude oil prices are rising. This further suggests that the current rally in June crude is suspect. |
Technical Writer for Technical Analysis of STOCKS & COMMODITIES magazine, Working-Money.com, and Traders.com Advantage.
| Title: | Technical Writer |
| Company: | Technical Analysis, Inc. |
| Address: | 4757 California Avenue SW |
| Seattle, WA 98116 | |
| Phone # for sales: | 206 938 0570 |
| Fax: | 206 938 1307 |
| Website: | www.Traders.com |
| E-mail address: | DPenn@traders.com |
Traders' Resource Links | |
| Charting the Stock Market: The Wyckoff Method -- Books | |
| Working-Money.com -- Online Trading Services | |
| Traders.com Advantage -- Online Trading Services | |
| Technical Analysis of Stocks & Commodities -- Publications and Newsletters | |
| Working Money, at Working-Money.com -- Publications and Newsletters | |
| Traders.com Advantage -- Publications and Newsletters | |
| Professional Traders Starter Kit -- Software | |
Click here for more information about our publications!
Comments

Request Information From Our Sponsors
- VectorVest, Inc.
- Executive Premier Workshop
- One-Day Options Course
- OptionsPro
- Retirement Income Workshop
- Sure-Fire Trading Systems (VectorVest, Inc.)
- Trading as a Business Workshop
- VectorVest 7 EOD
- VectorVest 7 RealTime/IntraDay
- VectorVest AutoTester
- VectorVest Educational Services
- VectorVest OnLine
- VectorVest Options Analyzer
- VectorVest ProGraphics v6.0
- VectorVest ProTrader 7
- VectorVest RealTime Derby Tool
- VectorVest Simulator
- VectorVest Variator
- VectorVest Watchdog
- StockCharts.com, Inc.
- Candle Patterns
- Candlestick Charting Explained
- Intermarket Technical Analysis
- John Murphy on Chart Analysis
- John Murphy's Chart Pattern Recognition
- John Murphy's Market Message
- MurphyExplainsMarketAnalysis-Intermarket Analysis
- MurphyExplainsMarketAnalysis-Visual Analysis
- StockCharts.com
- Technical Analysis of the Financial Markets
- The Visual Investor
