HOT TOPICS LIST
- MACD
- Fibonacci
- RSI
- Gann
- ADXR
- Stochastics
- Volume
- Triangles
- Futures
- Cycles
- Volatility
- ZIGZAG
- MESA
- Retracement
- Aroon
INDICATORS LIST
LIST OF TOPICS
PRINT THIS ARTICLE
by Koos van der Merwe
Possis Medical, Inc. (POSS) develops, manufactures and markets pioneering medical devices for cardiovascular and vascular treatment. Its primary product uses miniaturized waterjet technology, which enables cardiologists, radiologists, vascular surgeons, and other specialists to rapidly, safely and effectively remove blood clots throughout the body. The company holds ten US patents and three foreign patents relating to the AngioJet System.
Position: Hold
Koos van der Merwe
Has been a technical analyst since 1969, and has worked as a futures and options trader with First Financial Futures in Johannesburg, South Africa.
PRINT THIS ARTICLE
MOVING AVERAGES
Possis Medical
06/02/03 09:17:39 AMby Koos van der Merwe
Possis Medical, Inc. (POSS) develops, manufactures and markets pioneering medical devices for cardiovascular and vascular treatment. Its primary product uses miniaturized waterjet technology, which enables cardiologists, radiologists, vascular surgeons, and other specialists to rapidly, safely and effectively remove blood clots throughout the body. The company holds ten US patents and three foreign patents relating to the AngioJet System.
Position: Hold
| As impressive as the company is, at the height of the technology boom in March 2000, Possis' price was only $14.90. Their highest price came in December 1996 when the stock reached $21.94. This high was retested in March 2002 after forming a double bottom with lows in August 1998 ($4.25) and in November 2000 ($3.62). This move appears to be contrary to the movement of the general market, suggesting this share bears watching. |
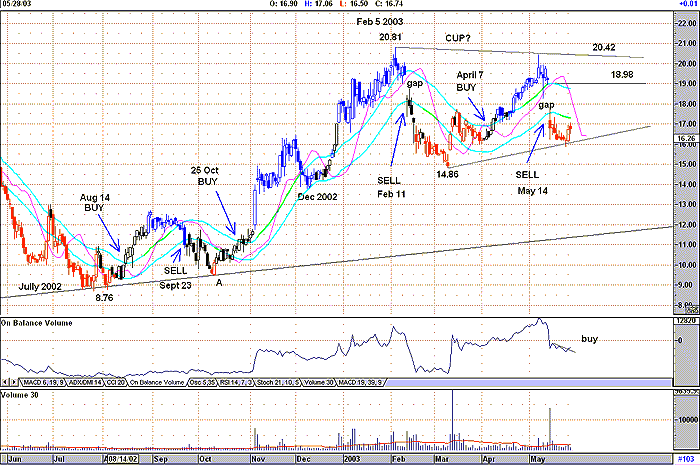
| The daily chart below shows how the share has moved up from the low in July 2002. Using the JM internal band strategy for analysis, we see that a BUY was given in August 2002 when the price broke above the upper JM band line. Optimizing the JM internal band for Possis gave a 28-day moving average band offset in either direction by 4%. |

|
| Possis Medical |
| Graphic provided by: AdvancedGET. |
| |
| On September 23rd a sell signal was given, and the share price fell to test its long-term support line at "A." From here it rose on volume that was slightly above average, giving a JM buy signal on October 25, 2002 at $11.39. The share price rose strongly testing but not breaking the lower JM band in December 2002. On February 5, 2003, on above average volume, the share price topped out, and falling on a gap, gave a JM sell signal on February 11, 2003. On April 7, 2003 it gave a buy signal by breaking above the upper JM band line at $17.21, reaching a high of $20.52 before falling back and gapping down through the lower JM band line on May 14th, giving a sell signal. This rise was possibly "buy on rumour and sell on fact" because on May 14th the following news hit the wires: |
| Possis Medical, Inc. Reports $0.15 per Share Pre-Tax Profit and Record Sales for Third Quarter 2003; Third Quarter Pre-Tax EPS Up 67% Versus Prior-Year Period. Either its earnings per share missed its "whisper" number, or there was something in the statements that did not satisfy fundamentalists. Technically however, the share looks interesting and bears watching for the following reasons: 1. Rising from the low in July 2002, the share price appears to be forming a triangle. A break above the upper resistance line at $20.42 could see it rise to $32.81. (20.81 - 8.76 = 12.05 + 20.81 = 32.86.) 2. Prices are inclined to rise to "fill a gap," and the price could rise from its present level of $16.74 to $18.98. Should it do so, it will give a JM buy signal, by crossing the upper JM band line. 3. The price could have formed a cup and handle formation within the triangle. The target should this be true, would be approximately $26. 4. Volume, as the share price fell, weakened to below average, which is a sign of strength. To recap, falling prices on rising volume equals weakness. Falling prices on falling volume equals strength. 5. Finally, the on-balance volume indicator has given a buy signal. |
| The share definitely looks interesting. Any break above the upper JM band line would be a strong buy signal. I would include the share in my watch list. |
Has been a technical analyst since 1969, and has worked as a futures and options trader with First Financial Futures in Johannesburg, South Africa.
| Address: | 3256 West 24th Ave |
| Vancouver, BC | |
| Phone # for sales: | 6042634214 |
| E-mail address: | petroosp@gmail.com |
Click here for more information about our publications!
PRINT THIS ARTICLE

Request Information From Our Sponsors
- StockCharts.com, Inc.
- Candle Patterns
- Candlestick Charting Explained
- Intermarket Technical Analysis
- John Murphy on Chart Analysis
- John Murphy's Chart Pattern Recognition
- John Murphy's Market Message
- MurphyExplainsMarketAnalysis-Intermarket Analysis
- MurphyExplainsMarketAnalysis-Visual Analysis
- StockCharts.com
- Technical Analysis of the Financial Markets
- The Visual Investor
- VectorVest, Inc.
- Executive Premier Workshop
- One-Day Options Course
- OptionsPro
- Retirement Income Workshop
- Sure-Fire Trading Systems (VectorVest, Inc.)
- Trading as a Business Workshop
- VectorVest 7 EOD
- VectorVest 7 RealTime/IntraDay
- VectorVest AutoTester
- VectorVest Educational Services
- VectorVest OnLine
- VectorVest Options Analyzer
- VectorVest ProGraphics v6.0
- VectorVest ProTrader 7
- VectorVest RealTime Derby Tool
- VectorVest Simulator
- VectorVest Variator
- VectorVest Watchdog
