HOT TOPICS LIST
- MACD
- Fibonacci
- RSI
- Gann
- ADXR
- Stochastics
- Volume
- Triangles
- Futures
- Cycles
- Volatility
- ZIGZAG
- MESA
- Retracement
- Aroon
INDICATORS LIST
LIST OF TOPICS
PRINT THIS ARTICLE
by Kevin Hopson
Rowan Cos. recently broke out of a bullish triangle formation and now looks to be forming a cup with handle.
Position: Accumulate
Kevin Hopson
Kevin has been a technical analyst for roughly 10 years now. Previously, Kevin owned his own business and acted as a registered investment advisor, specializing in energy. He was also a freelance oil analyst for Orient Trading Co., a commodity futures trading firm in Japan. Kevin is currently a freelance writer.
PRINT THIS ARTICLE
TECHNICAL ANALYSIS
Rowan's Triangle Breakout with a Developing Cup and Handle
05/29/03 08:35:06 AMby Kevin Hopson
Rowan Cos. recently broke out of a bullish triangle formation and now looks to be forming a cup with handle.
Position: Accumulate
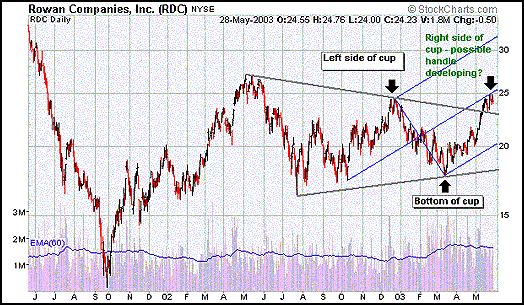
| Rowan Companies, Inc. (RDC) is a provider of onshore and offshore contract drilling services, as well as aviation services, both domestically and internationally. Technically speaking, the stock recently broke out of a one-year bullish triangle formation, indicating the potential for higher prices in the long-term. This is illustrated by the gray trendlines in the two-year chart. However, another pattern is developing, which would support the theory for further price appreciation down the road. |
| More specifically, Rowan has put in a U-shaped bottom, also known as a cup, which is indicated by the black arrows. This is considered a long-term continuation pattern and is usually a bullish sign. However, it is still unclear whether or not a handle is developing. For this to occur, Rowan will have to stay in the upper third of the cup formation during its consolidation phase. In other words, the stock will have to see flat-to-slightly lower trading in the near-term, as a sell-off would likely ruin this formation. Additionally, volume should decline during this period. |

|
| Graphic provided by: Stockcharts.com. |
| |
| If a handle does develop and Rowan proceeds to break out above the $25.00 level, the ultimate upside target (based on the depth of the cup) would be roughly $32.00. This would coincide with two other price targets. For example, you will notice that the median line of the blue pitchfork is currently capping prices. If Rowan does break to the upside, the top parallel line, which is converging around the $32.00 level, would be the next upside target. Additionally, the recent triangle breakout indicates a potential upside target of $33.00. |
| As a result, I believe a price target of $32.00 to $33.00 is definitely obtainable in the long-term. In the meantime, I would look for Rowan to consolidate in the $23.00 to $25.00 range, with the May 2002 downtrend line (broken resistance) acting as ultimate support in the near-term. Furthermore, I would look to accumulate shares of Rowan on any short-term weakness. |
Kevin has been a technical analyst for roughly 10 years now. Previously, Kevin owned his own business and acted as a registered investment advisor, specializing in energy. He was also a freelance oil analyst for Orient Trading Co., a commodity futures trading firm in Japan. Kevin is currently a freelance writer.
| Glen Allen, VA | |
| E-mail address: | hopson_1@yahoo.com |
Click here for more information about our publications!
PRINT THIS ARTICLE

Request Information From Our Sponsors
- StockCharts.com, Inc.
- Candle Patterns
- Candlestick Charting Explained
- Intermarket Technical Analysis
- John Murphy on Chart Analysis
- John Murphy's Chart Pattern Recognition
- John Murphy's Market Message
- MurphyExplainsMarketAnalysis-Intermarket Analysis
- MurphyExplainsMarketAnalysis-Visual Analysis
- StockCharts.com
- Technical Analysis of the Financial Markets
- The Visual Investor
- VectorVest, Inc.
- Executive Premier Workshop
- One-Day Options Course
- OptionsPro
- Retirement Income Workshop
- Sure-Fire Trading Systems (VectorVest, Inc.)
- Trading as a Business Workshop
- VectorVest 7 EOD
- VectorVest 7 RealTime/IntraDay
- VectorVest AutoTester
- VectorVest Educational Services
- VectorVest OnLine
- VectorVest Options Analyzer
- VectorVest ProGraphics v6.0
- VectorVest ProTrader 7
- VectorVest RealTime Derby Tool
- VectorVest Simulator
- VectorVest Variator
- VectorVest Watchdog
