HOT TOPICS LIST
- MACD
- Fibonacci
- RSI
- Gann
- ADXR
- Stochastics
- Volume
- Triangles
- Futures
- Cycles
- Volatility
- ZIGZAG
- MESA
- Retracement
- Aroon
INDICATORS LIST
LIST OF TOPICS
PRINT THIS ARTICLE
by Gary Grosschadl
CNQR does a dramatic breakout of an ascending triangle.
Position: Hold
Gary Grosschadl
Independent Canadian equities trader and technical analyst based in Peterborough
Ontario, Canada.
PRINT THIS ARTICLE
ASCENDING TRIANGLES
Concur Technologies Breaks Out
05/29/03 01:29:45 PMby Gary Grosschadl
CNQR does a dramatic breakout of an ascending triangle.
Position: Hold
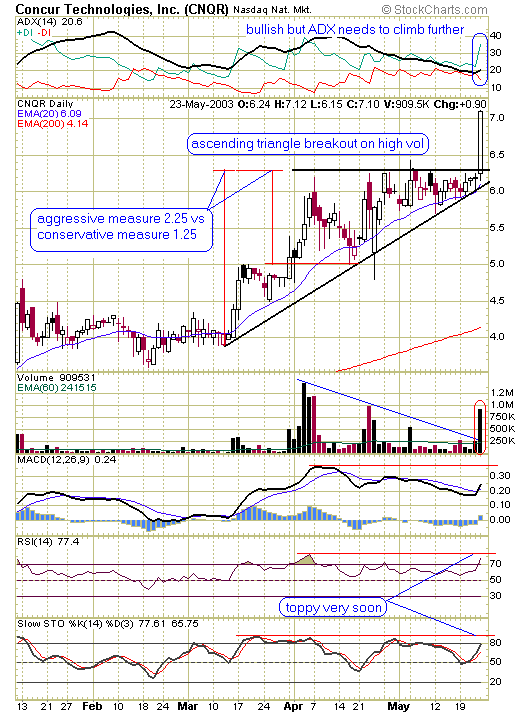
| This looks like a classic breakout from this bullish formation called an ascending triangle. This is typically a continuation pattern in an existing uptrend and this is certainly the case here. The volume trend is excellent as volume should be declining through the formation (this indicates quiet and steady accumulation) until there is a high volume breakout and was the case here. |
| The problem for traders not already in is that the move may have been too large so upside in the short-term could be limited. Now is a good time to consider the guidelines of a measured move for this pattern. The measurement comes from the widest part of the triangle and then applying it to the actual breakout zone. I am showing two measurements here: a bolder, more aggressive one from the very start of the triangle and a more conservative one at the $5 level which relates to an important test of support. I am suggesting that since the breakout move was possibly too large in the short-term that the more conservative measure be used in the short-term. This measure is $1.25 so adding it to the breakout area of 6.25 = $7.50 as the estimated target. However in the longer term, after a period of consolidation or retracement, I would target the full and bolder measure of $2.25, bringing the target to an estimated $8.50. |

|
| Daily chart for CNQR. |
| Graphic provided by: Stockcharts.com. |
| |
| Looking at some of the indicators, it is no surprise to see stochastics and the RSI (relative strength index) quickly approaching the toppy zone. Note that there is more upside room showing on the MACD (moving average convergence/divergence). The trend strength indicator at the top of the chart shows a bullish setup but the ADX is not overly powerful here at 20.6 but it is upsloping. |
| Congratulations if you are in this stock already but for those wishing to get in, it may be a better and safer plan to wait for the next ride up on this stock after a period of consolidation. This could take the form of a tight flag formation or perhaps a retracement to test mid-candle support around 6.70. Then the stock is in a better position to make a move to 8.50, bringing the more aggressive pattern measurement into the picture. Should the pattern fall short of the target there is still good room to take profits, provided you time a good entry after any consolidation that may occur. |
Independent Canadian equities trader and technical analyst based in Peterborough
Ontario, Canada.
| Website: | www.whatsonsale.ca/financial.html |
| E-mail address: | gwg7@sympatico.ca |
Click here for more information about our publications!
PRINT THIS ARTICLE

|

Request Information From Our Sponsors
- VectorVest, Inc.
- Executive Premier Workshop
- One-Day Options Course
- OptionsPro
- Retirement Income Workshop
- Sure-Fire Trading Systems (VectorVest, Inc.)
- Trading as a Business Workshop
- VectorVest 7 EOD
- VectorVest 7 RealTime/IntraDay
- VectorVest AutoTester
- VectorVest Educational Services
- VectorVest OnLine
- VectorVest Options Analyzer
- VectorVest ProGraphics v6.0
- VectorVest ProTrader 7
- VectorVest RealTime Derby Tool
- VectorVest Simulator
- VectorVest Variator
- VectorVest Watchdog
- StockCharts.com, Inc.
- Candle Patterns
- Candlestick Charting Explained
- Intermarket Technical Analysis
- John Murphy on Chart Analysis
- John Murphy's Chart Pattern Recognition
- John Murphy's Market Message
- MurphyExplainsMarketAnalysis-Intermarket Analysis
- MurphyExplainsMarketAnalysis-Visual Analysis
- StockCharts.com
- Technical Analysis of the Financial Markets
- The Visual Investor
