HOT TOPICS LIST
- MACD
- Fibonacci
- RSI
- Gann
- ADXR
- Stochastics
- Volume
- Triangles
- Futures
- Cycles
- Volatility
- ZIGZAG
- MESA
- Retracement
- Aroon
INDICATORS LIST
LIST OF TOPICS
PRINT THIS ARTICLE
by Kevin Hopson
The AMEX Oil Index continues to move higher after breaking out of a falling wedge formation. However, long-term downtrend and Fibonacci resistance could turn back prices in the near-term.
Position: Accumulate
Kevin Hopson
Kevin has been a technical analyst for roughly 10 years now. Previously, Kevin owned his own business and acted as a registered investment advisor, specializing in energy. He was also a freelance oil analyst for Orient Trading Co., a commodity futures trading firm in Japan. Kevin is currently a freelance writer.
PRINT THIS ARTICLE
TECHNICAL ANALYSIS
AMEX Oil Index Currently Testing Downtrend Resistance
05/30/03 02:09:47 PMby Kevin Hopson
The AMEX Oil Index continues to move higher after breaking out of a falling wedge formation. However, long-term downtrend and Fibonacci resistance could turn back prices in the near-term.
Position: Accumulate
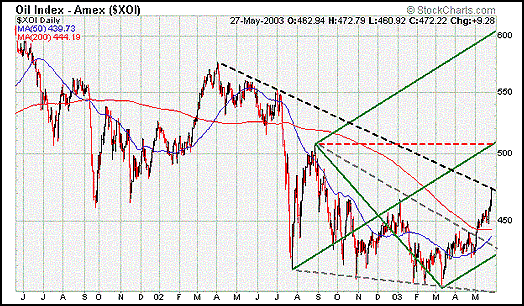
| I touched on the AMEX Oil Index (XOI), a price-weighted index of integrated oil companies, a couple of weeks ago. More specifically, I said that the recent falling wedge breakout (illustrated by the dotted gray lines) likely indicated the beginning of a new uptrend. In other words, I felt a two-year downtrend had been completed so I recommended that long-term investors accumulate these stocks on weakness. Though the index initially pulled back, as expected, integrated oil companies have continued to move higher the last two weeks. |
| However, the index is now testing downtrend resistance from the April 2002 high, which is indicated by the dotted black line. Additionally, the 38.2 percent retracement level from the April '02 to March '03 decline comes in right at current levels. As a result, there is the possibility for a pullback in the near-term. If this comes to fruition, I would continue to accumulate shares of integrated oil stocks, as this group looks to be in the beginning stages of a long-term uptrend. |

|
| Graphic provided by: Stockcharts.com. |
| |
| The index's 10-day (457) and 20-day (450) moving averages should provide initial support but if a more significant correction occurs, the 200-day moving average (444) would be an ideal entry point. However, if the index proceeds to break key resistance at current levels, look for a potential test of the 510 level in the near-term. This is the site of last August's high (dotted red line), the 61.8 percent retracement level from the April '02 to March '03 decline and the green median line. |
Kevin has been a technical analyst for roughly 10 years now. Previously, Kevin owned his own business and acted as a registered investment advisor, specializing in energy. He was also a freelance oil analyst for Orient Trading Co., a commodity futures trading firm in Japan. Kevin is currently a freelance writer.
| Glen Allen, VA | |
| E-mail address: | hopson_1@yahoo.com |
Click here for more information about our publications!
Comments
Date: 06/01/03Rank: 4Comment:
Date: 06/05/03Rank: 5Comment:

Request Information From Our Sponsors
- StockCharts.com, Inc.
- Candle Patterns
- Candlestick Charting Explained
- Intermarket Technical Analysis
- John Murphy on Chart Analysis
- John Murphy's Chart Pattern Recognition
- John Murphy's Market Message
- MurphyExplainsMarketAnalysis-Intermarket Analysis
- MurphyExplainsMarketAnalysis-Visual Analysis
- StockCharts.com
- Technical Analysis of the Financial Markets
- The Visual Investor
- VectorVest, Inc.
- Executive Premier Workshop
- One-Day Options Course
- OptionsPro
- Retirement Income Workshop
- Sure-Fire Trading Systems (VectorVest, Inc.)
- Trading as a Business Workshop
- VectorVest 7 EOD
- VectorVest 7 RealTime/IntraDay
- VectorVest AutoTester
- VectorVest Educational Services
- VectorVest OnLine
- VectorVest Options Analyzer
- VectorVest ProGraphics v6.0
- VectorVest ProTrader 7
- VectorVest RealTime Derby Tool
- VectorVest Simulator
- VectorVest Variator
- VectorVest Watchdog
